

Global epidemiology of sickle haemoglobin in neonates: a contemporary geostatistical model-based map and population estimates
- PMID: 23103089
- PMCID: PMC3547249
- DOI: 10.1016/S0140-6736(12)61229-X
Global epidemiology of sickle haemoglobin in neonates: a contemporary geostatistical model-based map and population estimates
Abstract
Background: Reliable estimates of populations affected by diseases are necessary to guide efficient allocation of public health resources. Sickle haemoglobin (HbS) is the most common and clinically significant haemoglobin structural variant, but no contemporary estimates exist of the global populations affected. Moreover, the precision of available national estimates of heterozygous (AS) and homozygous (SS) neonates is unknown. We aimed to provide evidence-based estimates at various scales, with uncertainty measures.
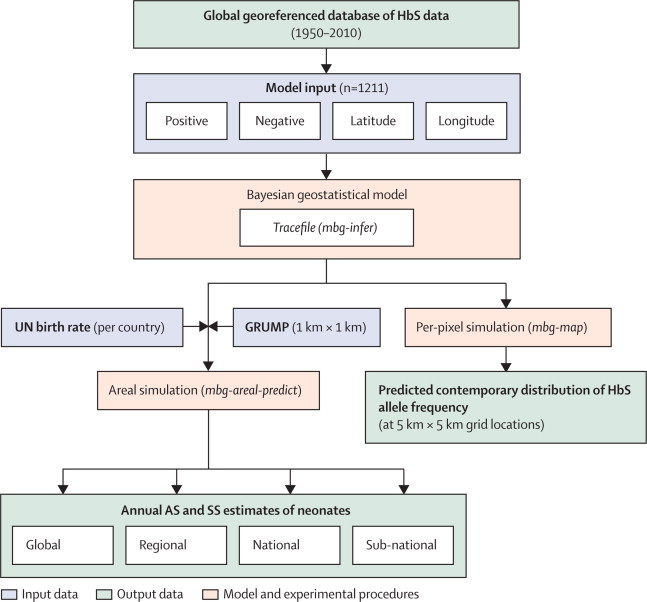
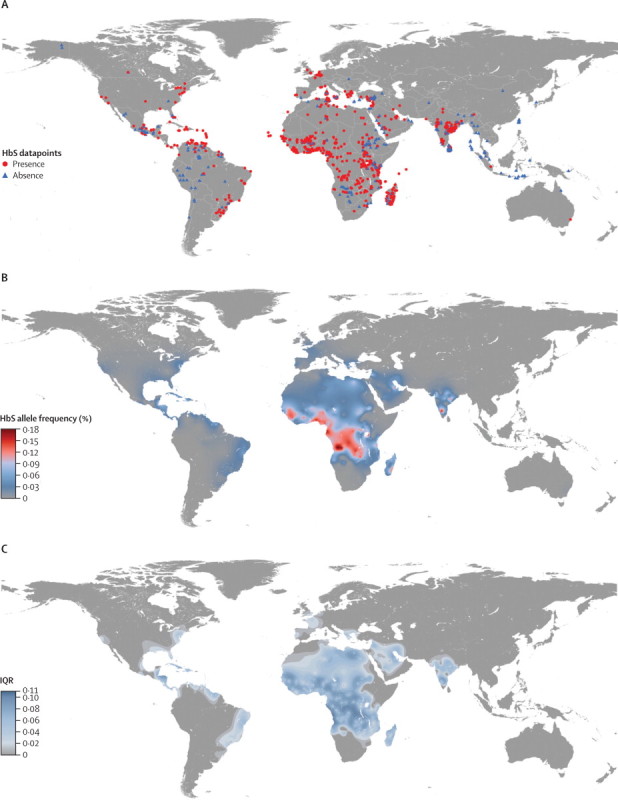
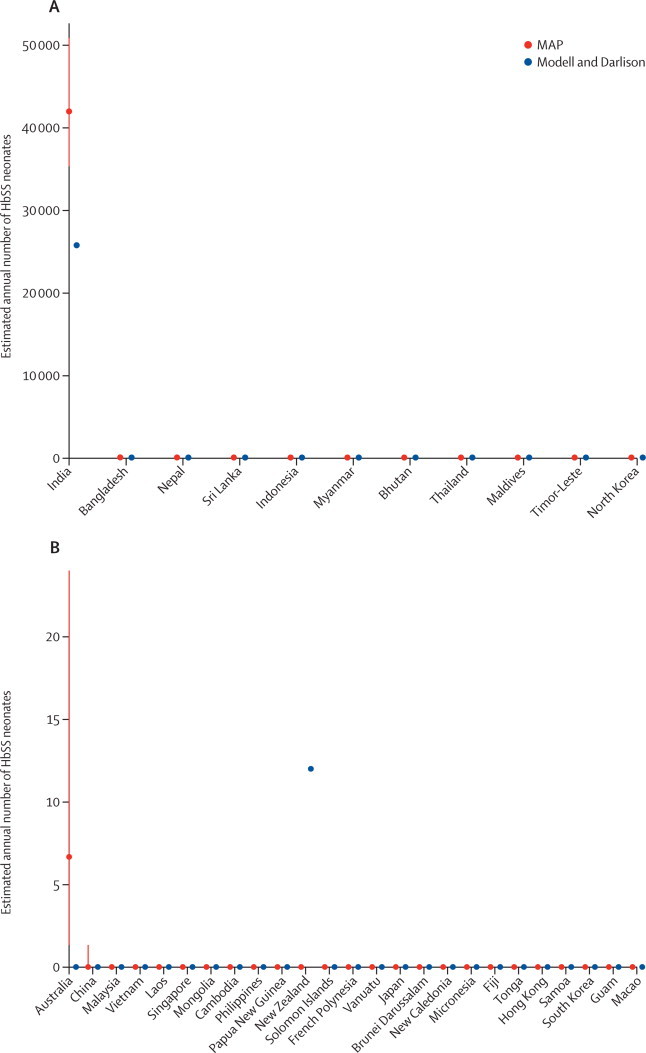
Methods: Using a database of sickle haemoglobin surveys, we created a contemporary global map of HbS allele frequency distribution within a Bayesian geostatistical model. The pairing of this map with demographic data enabled calculation of global, regional, and national estimates of the annual number of AS and SS neonates. Subnational estimates were also calculated in data-rich areas.
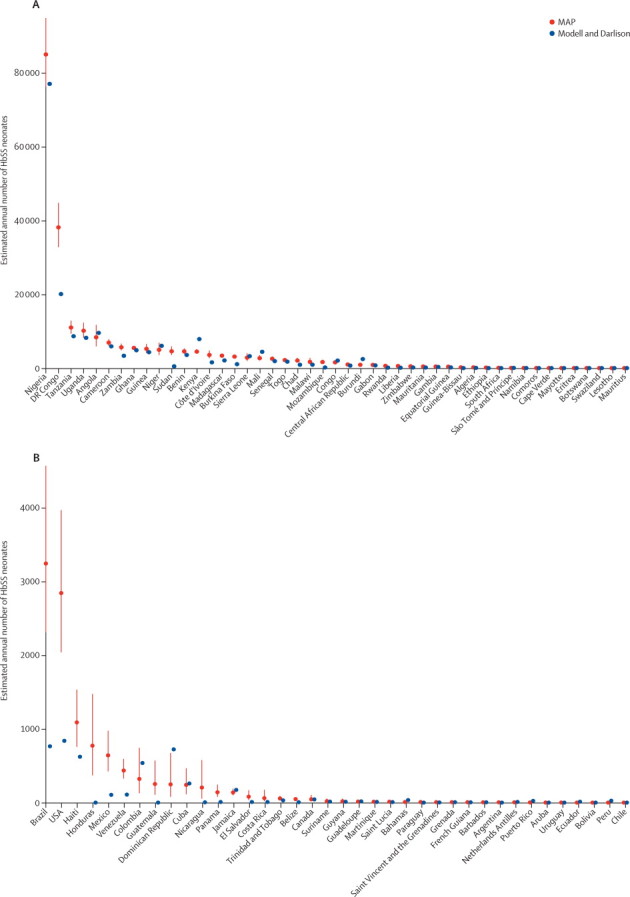
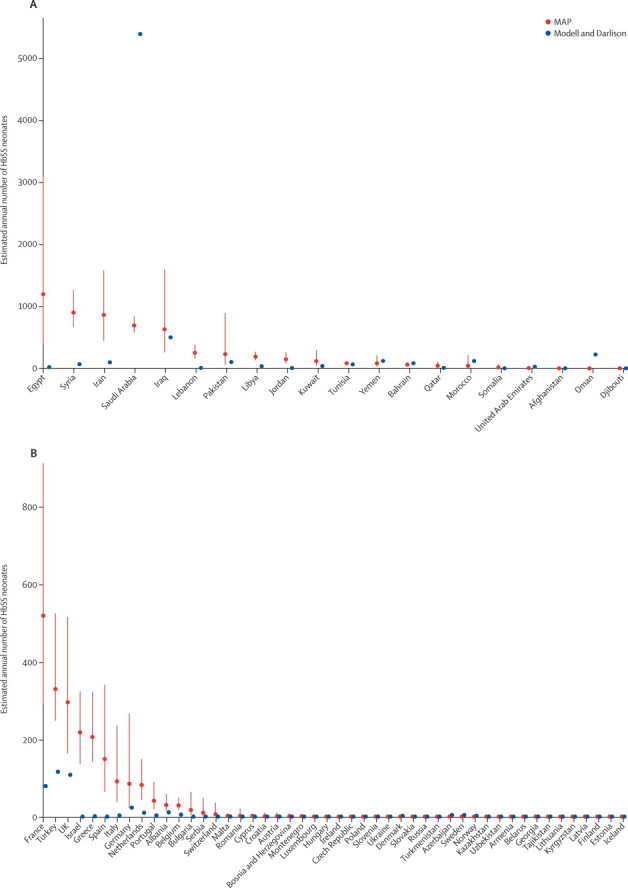
Findings: Our map shows subnational spatial heterogeneities and high allele frequencies across most of sub-Saharan Africa, the Middle East, and India, as well as gene flow following migrations to western Europe and the eastern coast of the Americas. Accounting for local heterogeneities and demographic factors, we estimated that the global number of neonates affected by HbS in 2010 included 5,476,000 (IQR 5,291,000-5,679,000) AS neonates and 312,000 (294,000-330,000) SS neonates. These global estimates are higher than previous conservative estimates. Important differences predicted at the national level are discussed.
Interpretation: HbS will have an increasing effect on public health systems. Our estimates can help countries and the international community gauge the need for appropriate diagnoses and genetic counselling to reduce the number of neonates affected. Similar mapping and modelling methods could be used for other inherited disorders.
Funding: The Wellcome Trust.
Copyright © 2013 Elsevier Ltd. All rights reserved.
Figures
Comment in
-
Sickle-cell disorders: limits of descriptive epidemiology.Lancet. 2013 Jan 12;381(9861):98-9. doi: 10.1016/S0140-6736(12)61817-0. Epub 2012 Oct 25. Lancet. 2013. PMID: 23103088 No abstract available.
-
Burden of sickle cell disease in tribal students in Maa-Baadi institutions in southern Rajasthan - A pilot study.Indian J Med Res. 2022 Aug;156(2):269-274. doi: 10.4103/ijmr.ijmr_3195_21. Indian J Med Res. 2022. PMID: 36629186 Free PMC article.
References
-
- Weatherall D, Akinyanju O, Fucharoen S, Olivieri N, Musgrove P. Inherited disorders of hemoglobin. Disease control priorities in developing countries. 2nd edn. Oxford University Press; New York: 2006. pp. 663–680.
-
- Rees DC, Williams TN, Gladwin MT. Sickle-cell disease. Lancet. 2010;376:2018–2031. - PubMed
-
- Williams TN, Obaro SK. Sickle cell disease and malaria morbidity: a tale with two tails. Trends Parasitol. 2011;27:315–320. - PubMed
Publication types
MeSH terms
Substances
Grants and funding
LinkOut - more resources
Full Text Sources
Other Literature Sources
Medical
