. 2012 Dec 14;48(5):705-12.
doi: 10.1016/j.molcel.2012.09.016. Epub 2012 Oct 25.

Distinct single-cell morphological dynamics under beta-lactam antibiotics

Affiliations

Distinct single-cell morphological dynamics under beta-lactam antibiotics

Zhizhong Yao et al. Mol Cell. .

Abstract

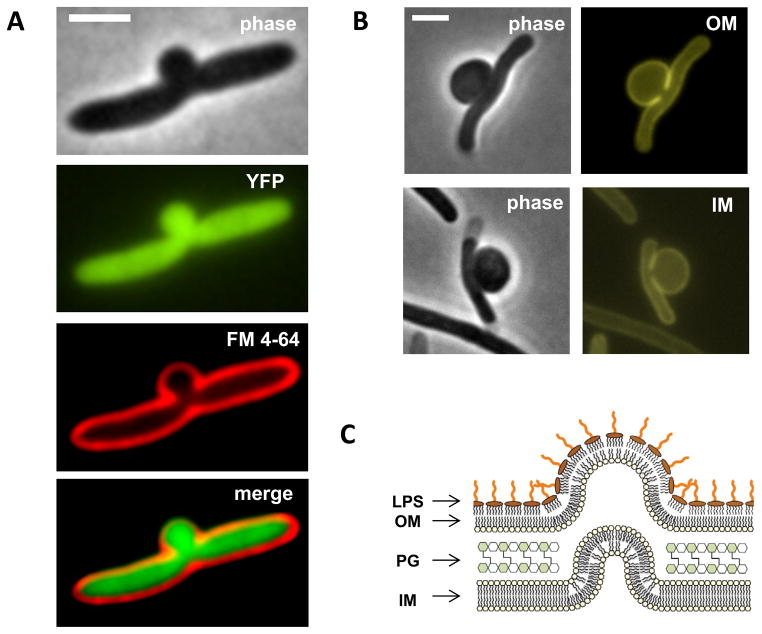
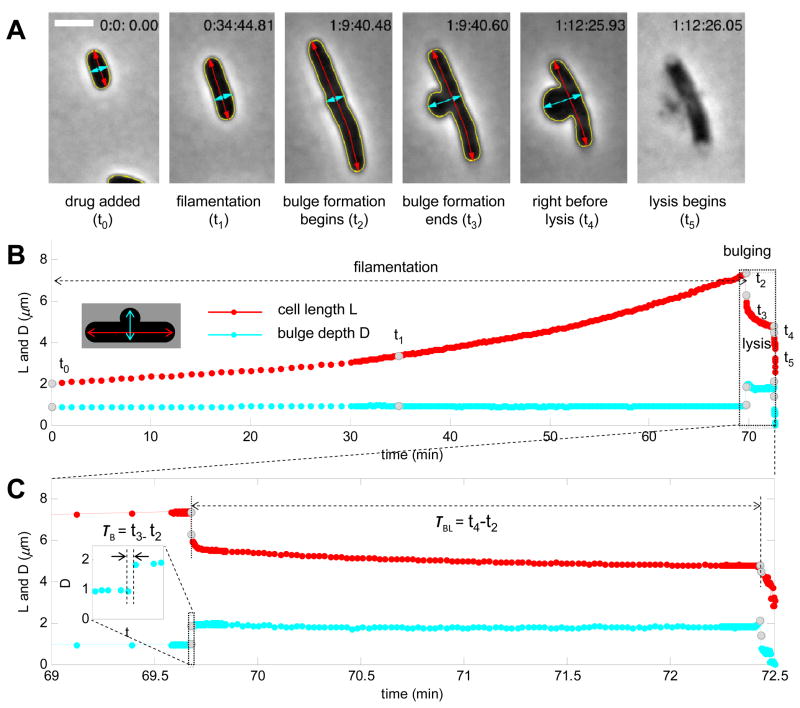
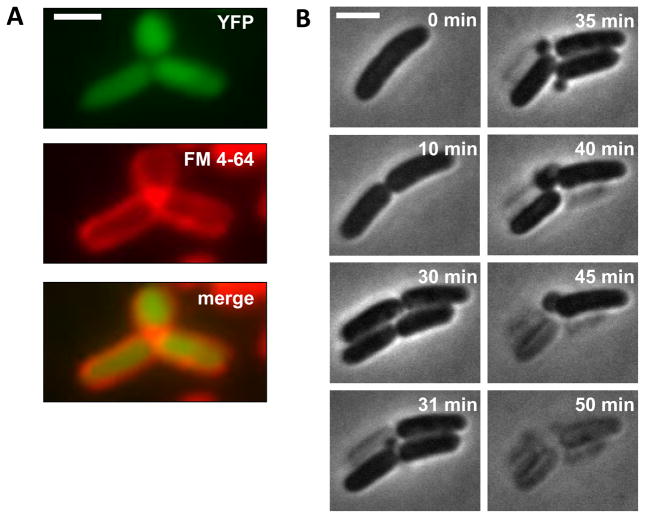
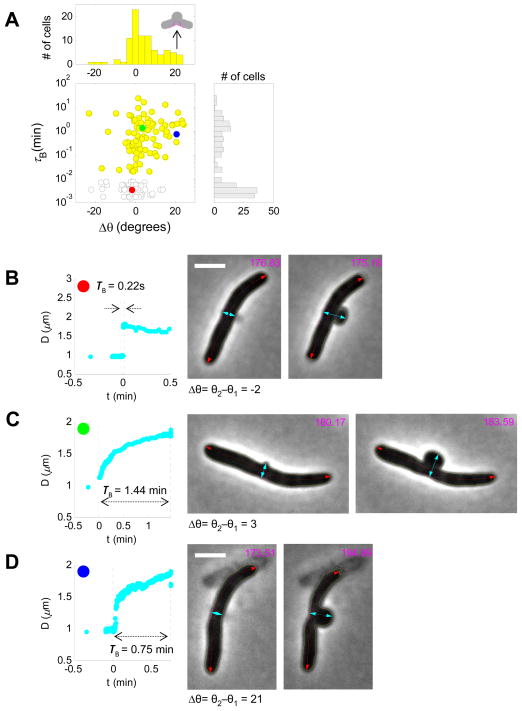
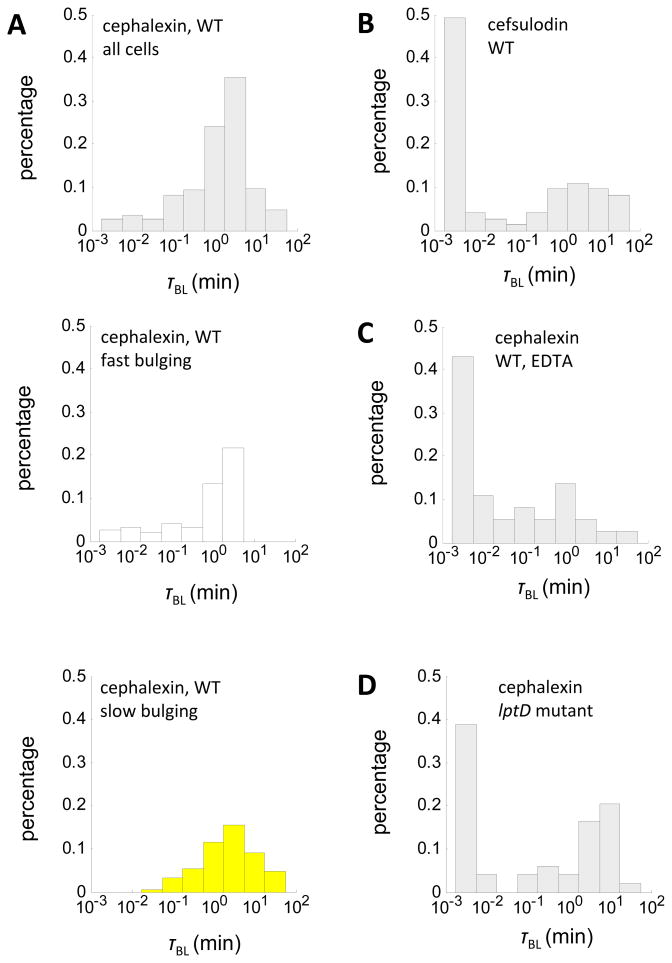
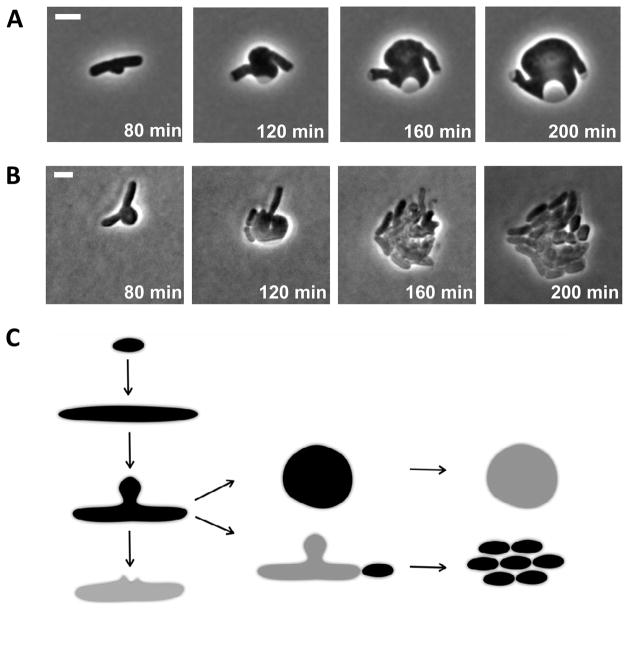
The bacterial cell wall is conserved in prokaryotes, stabilizing cells against osmotic stress. Beta-lactams inhibit cell-wall synthesis and induce lysis through a bulge-mediated mechanism; however, little is known about the formation dynamics and stability of these bulges. To capture processes of different timescales, we developed an imaging platform combining automated image analysis with live-cell microscopy at high time resolution. Beta-lactam killing of Escherichia coli cells proceeded through four stages: elongation, bulge formation, bulge stagnation, and lysis. Both the cell wall and outer membrane (OM) affect the observed dynamics; damaging the cell wall with different beta-lactams and compromising OM integrity cause different modes and rates of lysis. Our results show that the bulge-formation dynamics are determined by how the cell wall is perturbed. The OM plays an independent role in stabilizing the bulge once it is formed. The stabilized bulge delays lysis and allows recovery upon drug removal.


Figures

Figure 1
Figure 1. Both inner and outer membranes are intact in bulging cells
(A, B) Phase contrast and fluorescence images of bulging cells under cephalexin treatment (A, cytoplasmic YFP and FM 4–64 membrane staining; B, ZipA-mCherry, IM marker; ssPal-mCherry, OM marker). Membrane protrusions indicate PG defects at the potential division site. Leakage of cytoplasmic YFP into the bulge suggests redistribution of cytosol materials from cell filament to the midcell bulge. (C) Schematic illustration of a bulge as a cell wall-less cytosolic protrusion surrounded by both IM and OM. LPS is exclusively located at the outer leaflet of the OM and its long glycan chains facilitate a micelle-like close packing structure. All scale bars represent 2 μm. See also Figure S1.
Figure 2
Figure 2. Live cell microscopy with automated imaging analysis reveals bulge formation as an intermediate step towards lysis
(A) Selected images of a representative E. coli cell at different stages of cephalexin treatment (yellow, cell contour; red, cell length; cyan, bulge depth). The time of these snapshots (t0 ~ t5) is indicated in gray dots in panel B. (B, C) Measurement of cell length and bulge depth of a representative E. coli cell throughout beta-lactam treatment (B) and during bulging and lysis (C, zoom-in view of the box in panel B). Both bulge formation time (τB) and bulge lifetime (τBL, zoom-in inset in panel C) are defined based on bulge depth measurements. Adaptive time resolutions were adopted to characterize processes with different kinetics: 1 min/frame for the first 30 minutes after adding drug, 12.5 s/frame for filamentation and bulge stagnation, and ~125 ms/frame for bulge formation and final lysis. Take notice of the simultaneous cell length shrinkage during the abrupt bulge formation and the second increase in bulge depth right before lysis. Scale bar represents 2 μm. See also Figure S2 and Movie S1.
Figure 3
Figure 3. Cefsulodin-induced lysis shows shared as well as distinct features
(A) Fluorescence images of bulging cells treated with cefsulodin (cytoplasmic YFP and FM 4–64 membrane staining). No obvious membrane gap was observed between the bulge and the filament; (B) Selected snapshots of a representative E. coli cell at different stages of cefsulodin treatment. Bulge formation and separate lysis events occur at nascent poles on septated filaments. Scale bar represents 2 μm. See also Figure S3 and Movie S2.
Figure 4
Figure 4. Three distinct bulging patterns and dynamics within isogenic cell populations
(A) Scatter and histogram plots of bulge formation time (τB) and cracking angle (Δθ) reveal three different bulging patterns in response to cell wall damage by cephalexin: fast bulging without cracking (b, red dot, τB<10−2 min), slow bulging without cracking (c, green dot, τB>10−2 min), and slow bulging with cracking (d, blue dot, τB>10−2 min). Yellow dots and bar graphs represent slow bulging cells (top and middle panels). Gray bars represent all isogenic cells examined (N=195, right panel). (B–D) Representative bulge depth measurement and snapshots of cells before (t2) and after (t3) bulge formation for each bulging pattern. Magenta lines represent measurement of cracking angles. All scale bars represent 2 μm. See also Figure S4 and online supplementary movies for cell 6, cell 75 and cell 123.
Figure 5
Figure 5. Both modes of bulge formation and integrity of the OM affect bulge stability
(A) Bulge lifetime distribution of all wildtype cells (left, N=195), and subpopulation of fast bulging cells (middle, N=95) and slow bulging cells (right, N=100) under cephalexin treatment (50 μg/mL). (B) Bulge lifetime distribution of wildtype cells (N=73) under cefsulodin treatment (50 μg/mL). (C–D) Bulge lifetime distribution of EDTA-treated cells (N=37) and lptD mutants (N=49) under cephalexin treatment (50 μg/mL). See also Figure S5 and Movie S3.
Figure 6
Figure 6. Alternative cell fates of bulging cells
(A) Snapshots of spheroplast formation induced by cephalexin. Initial stages of spheroplast formation are identical with those of beta-lactam induced cell lysis. These remarkably stable spheroplasts lysed immediately upon Mg2+ removal, as judged by optical density drop of the liquid culture. (B) Snapshots of bulging cells reverting to rod shape cells upon drug removal. Cells with stabilized bulges escaped lysis by initiating septation near old poles and pinching off portions of the filaments. (C) Proposed model of beta-lactam induced bulges as a meta-stable state towards cell lysis, spheroplast formation, or reversion to rod-shaped cells. All scale bars represent 2 μm. See also Movie S4 and S5.

References

    1. Berry J, Summer EJ, Struck DK, Young R. The final step in the phage 39 infection cycle: the Rz and Rz1 lysis proteins link the inner and outer membranes. Mol Microbiol. 2008;70:341–351. - PMC - PubMed
    1. Birdsell DC, Cota-Robles EH. Production and ultrastructure of lysozyme 43 and ethylenediaminetetraacetate-lysozyme spheroplasts of Escherichia coli. J Bacteriol. 1967;44(93):427–437. - PMC - PubMed
    1. Chung HS, Yao Z, Goehring NW, Kishony R, Beckwith J, Kahne D. Rapid beta-lactam-induced lysis requires successful assembly of the cell division machinery. Proc Natl Acad Sci U S A. 2009;106:21872–21877. - PMC - PubMed
    1. Daly KE, Huang KC, Wingreen NS, Mukhopadhyay R. Mechanics of membrane bulging during cell-wall disruption in Gram-negative bacteria. Phys Rev E Stat Nonlin Soft Matter Phys. 2011;83:041922. - PubMed
    1. de Pedro MA, Holtje JV, Schwarz H. Fast lysis of Escherichia coli filament cells requires differentiation of potential division sites. Microbiology. 2002;148:79–86. - PubMed

Publication types

MeSH terms