. 2013 Jan 1;304(1):H58-71.
doi: 10.1152/ajpheart.00476.2012. Epub 2012 Oct 26.

Identification of L- and T-type Ca2+ channels in rat cerebral arteries: role in myogenic tone development

Affiliations

Identification of L- and T-type Ca2+ channels in rat cerebral arteries: role in myogenic tone development

Rasha R Abd El-Rahman et al. Am J Physiol Heart Circ Physiol. .

Abstract

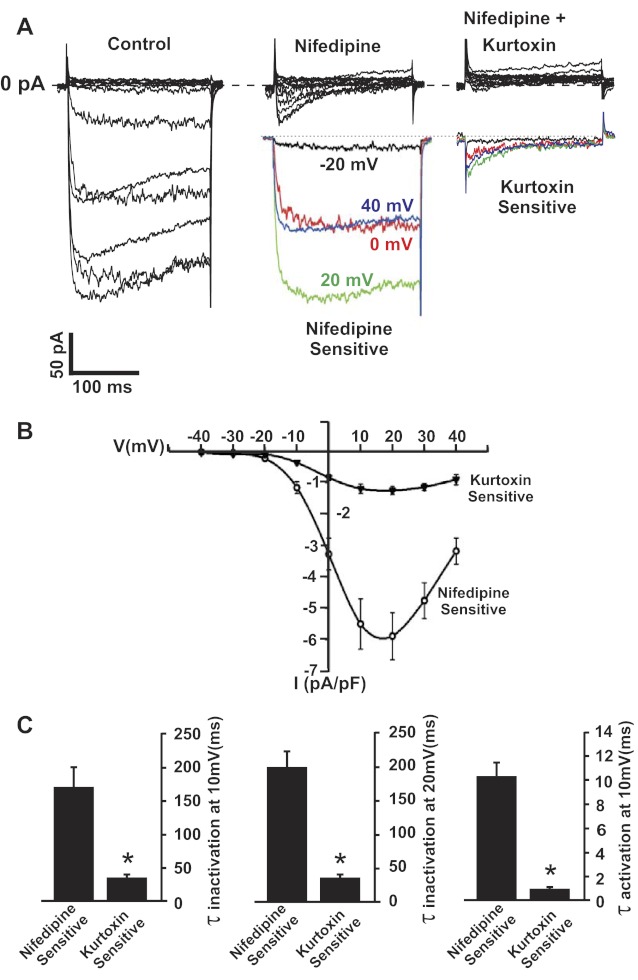
L-type Ca(2+) channels are broadly expressed in arterial smooth muscle cells, and their voltage-dependent properties are important in tone development. Recent studies have noted that these Ca(2+) channels are not singularly expressed in vascular tissue and that other subtypes are likely present. In this study, we ascertained which voltage-gated Ca(2+) channels are expressed in rat cerebral arterial smooth muscle and determined their contribution to the myogenic response. mRNA analysis revealed that the α(1)-subunit of L-type (Ca(v)1.2) and T-type (Ca(v)3.1 and Ca(v)3.2) Ca(2+) channels are present in isolated smooth muscle cells. Western blot analysis subsequently confirmed protein expression in whole arteries. With the use of patch clamp electrophysiology, nifedipine-sensitive and -insensitive Ba(2+) currents were isolated and each were shown to retain electrical characteristics consistent with L- and T-type Ca(2+) channels. The nifedipine-insensitive Ba(2+) current was blocked by mibefradil, kurtoxin, and efonidpine, T-type Ca(2+) channel inhibitors. Pressure myography revealed that L-type Ca(2+) channel inhibition reduced tone at 20 and 80 mmHg, with the greatest effect at high pressure when the vessel is depolarized. In comparison, the effect of T-type Ca(2+) channel blockade on myogenic tone was more limited, with their greatest effect at low pressure where vessels are hyperpolarized. Blood flow modeling revealed that the vasomotor responses induced by T-type Ca(2+) blockade could alter arterial flow by ∼20-50%. Overall, our findings indicate that L- and T-type Ca(2+) channels are expressed in cerebral arterial smooth muscle and can be electrically isolated from one another. Both conductances contribute to myogenic tone, although their overall contribution is unequal.


Figures

Fig. 1.
Fig. 1.
mRNA expression of the α1-subunit of voltage-gated Ca2+ channels. Whole arteries or isolated smooth muscle cells from middle/posterior cerebral arteries were collected and processed for RT-PCR. CaV α1-subunit expression in whole cerebral arteries (A) and in enzymatically isolated smooth muscle cells (B) is shown. M, molecular marker lane. Note that data in A (middle) and B (middle) originate from the same gel.
Fig. 2.
Fig. 2.
Protein expression of the α1-subunits of voltage-gated Ca2+ channels. Rat cortex along with vessel segments from middle/posterior cerebral arteries were collected and prepared for Western blot analysis. Protein extracts were electrophoresed on 5.6% polyacrylamide gel, transferred to polyvinylidene difluoride, and then labeled with primary antibodies against CaV1.2, CaV3.1, and CaV3.2.
Fig. 3.
Fig. 3.
Inward Ba2+ currents in cerebral arterial smooth muscle cells. Whole-cell patch clamp electrophysiology was used to measure Ba2+ currents in smooth muscle cells isolated from middle/posterior cerebral arteries. The voltage protocol consisted of a prepulse to −60 or −90 mV (200 ms) followed by a series of steps [−80 to +40 mV (200 ms, 10-mV increments)]. A: representative Ba2+ currents from a smooth muscle cell exposed to a prepulse to −60 or −90 mV. B: current-voltage (I-V) plot of peak inward Ba2+ current (n = 6). *Significant difference from the −60 prepulse (paired t-test, P ≤ 0.05).
Fig. 4.
Fig. 4.
Nifedipine-sensitive and -insensitive Ba2+ currents in cerebral arterial smooth muscle cells. Whole-cell patch clamp electrophysiology was used to measure Ba2+ currents in smooth muscle cells isolated from middle/posterior cerebral arteries. The voltage protocol consisted of a prepulse from −60 to −90 mV (200 ms) followed by a series of steps [−80 to +40 mV (300 ms, 10-mV increments)]. A: representative Ba2+ current under control condition (left) and in the presence of nifedipine 300 nM (right). B: I-V plot of peak inward Ba2+ current along with the nifedipine-sensitive and -insensitive components (n = 6). C: I-V plot of the nifedipine-sensitive and -insensitive Ba2+ current expressed related to maximal current at +10 mV.
Fig. 5.
Fig. 5.
Effects of mibefradil on the nifedipine-insensitive component of the inward Ba2+ current. Whole-cell patch clamp electrophysiology was used to measure Ba2+ currents in smooth muscle cells isolated from middle/posterior cerebral arteries. The voltage protocol consisted of a prepulse from −60 to −90 mV (200 ms) followed by a series of steps [−80 to +40 mV (200 ms, 10-mV increments)]. This protocol was run under control conditions and in the presence of nifedipine (300 nM) ± mibefradil (5 μM). A: representative traces of Ba2+ current under control conditions and in the presence of nifedipine and mibefradil. B: I-V plot of nifedipine and mibefradil-sensitive current (n = 9). C: time constant (τ) for activation and inactivation (n = 9). *Significant difference from the nifedipine-sensitive current (paired t-test, P ≤ 0.05).
Fig. 6.
Fig. 6.
Effects of kurtoxin on the nifedipine-insensitive component of the inward Ba2+ current. Whole-cell patch clamp electrophysiology was used to measure Ba2+ currents in smooth muscle cells isolated from middle/posterior cerebral arteries. The voltage protocol consisted of a prepulse from −60 to −90 mV (200 ms) followed by a series of steps [−80 to +40 mV (200 ms, 10-mV increments)]. This protocol was run under control conditions and in the presence of nifedipine (300 nM) ± kurtoxin (5 μM). A: representative traces of Ba2+ current under control conditions and in the presence of nifedipine and kurtoxin. B: I-V plot of nifedipine- and kurtoxin-sensitive current (n = 6). C: time constant (τ) for activation and inactivation (n = 6). *Significant difference from the nifedipine-sensitive current (paired t-test, P ≤ 0.05).
Fig. 7.
Fig. 7.
Effects of efonidipine on the nifedipine-insensitive component of the inward Ba2+ current. Whole-cell patch clamp electrophysiology was used to measure Ba2+ currents in smooth muscle cells isolated from middle/posterior cerebral arteries. The voltage protocol consisted of a prepulse from −60 to −90 mV (200 ms) followed by a series of steps [−80 to +40 mV (200 ms, 10-mV increments)]. This protocol was run under control conditions and in the presence of nifedipine (300 nM) ± efonidipine (3 μM). A: representative traces of Ba2+ current under control conditions and in the presence of nifedipine and efonidipine. B: I-V plot of nifedipine and efonidipine-sensitive current (n = 6). C: time constant (τ) for activation and inactivation (n = 6). *Significant difference from the nifedipine-sensitive current (paired t-test, P ≤ 0.05).
Fig. 8.
Fig. 8.
The effects of nifedipine and mibefradil on myogenic tone. Cerebral arteries were pressurized to 20 or 80 mmHg while diameter was monitored in the absence and presence of nifedipine (50 and 300 nM) and mibefradil (1 and 5 μm). A and B: representative traces revealing the effect of nifedipine and mibefradil on cerebral arteries pressurized to 20 or 80 mmHg. C and D: summary data denoting the influence nifedipine and mibefradil on cerebral arteries pressurized to 20 (n = 7) or 80 (n = 6) mmHg. *Significant increase from control; **significant increase from nifedipine (300 nM); paired t-test, P ≤ 0.05. E: nifedipine and mibefradil-sensitive vasomotor responses are plotted as an absolute change or as a percentage of maximal response. *Significant difference from 20 mmHg (unpaired t-test, P ≤ 0.05).
Fig. 9.
Fig. 9.
The effects of nifedipine and efonidipine on myogenic tone. Cerebral arteries were pressurized to 20 or 80 mmHg while diameter was monitored in the absence and presence of nifedipine (50 and 300 nM) and efonidipine (3 μm). A and B: representative traces revealing the effect of nifedipine and efondipine on cerebral arteries pressurized to 20 or 80 mmHg. C and D: summary data denoting the influence nifedipine and efonidipine on cerebral arteries pressurized to 20 (n = 5) or 80 (n = 6) mmHg. *Significant increase from control; **significant increase from nifedipine (300 nM); paired t-test, P ≤ 0.05. E: nifedipine and efondipine-sensitive vasomotor responses are plotted as an absolute change or as a percentage of maximal response. *Significant difference from 20 mmHg (unpaired t-test, P ≤ 0.05).
Fig. 10.
Fig. 10.
The effects of nifedipine and kurtoxin on myogenic tone. Cerebral arteries were pressurized to 20 or 80 mmHg while diameter was monitored in the absence and presence of nifedipine (50 and 300 nM) and kurtoxin (1 μm). A and B: representative traces revealing the effect of nifedipine and kurtoxin on cerebral arteries pressurized to 20 or 80 mmHg. C and D: summary data denoting the influence nifedipine and kurtoxin on cerebral arteries pressurized to 20 (n = 5) or 80 (n = 6) mmHg. *Significant increase from control; **significant increase from nifedipine (300 nM); paired t-test, P ≤ 0.05. E: nifedipine and kurtoxin-sensitive vasomotor responses are plotted as an absolute change or as a percentage of maximal response. *Significant difference from 20 mmHg (unpaired t-test, P ≤ 0.05).
Fig. 11.
Fig. 11.
The effects of nifedipine and mibefradil on myogenic tone through a full range of intravascular pressures. Cerebral arteries were sequentially pressurized from 20 to 100 mmHg while arterial diameter was monitored in the absence and presence of nifedipine (300 nM) and mibefradil (5 μM). A: representative traces revealing the effect of nifedipine and mibefradil on cerebral arteries sequentially pressurized between 20 and 100 mmHg. B and C: nifedipine and mibefradil-sensitive vasomotor responses are plotted as an absolute change or as a percentage of maximal response. Absolute diameter (in μm) for control and Ca2+ free were as follows (n = 6): 20 mmHg, 175 ± 4, 188 ± 3; 40 mmHg, 171 ± 2, 211 ± 4; 60 mmHg, 153 ± 3, 220 ± 4; 80 mmHg, 142 ± 4, 227 ± 4; and 100 mmHg, 135 ± 4 , 234 ± 4. *Significant difference from the preceding pressure step (paired t-test, P ≤ 0.05).
Fig. 12.
Fig. 12.
Computational modeling predicts that T-type Ca2+ channel modulation alters tissue blood flow. A: a computational model (15, 46, 47) was used to calculate 2-phase steady-state flow through an arterial network consisting of 7 arterial branches whose diameter/length approximates the posterior cerebral arterial network diverging off the Circle of Willis. This model implements conservation of blood and red blood cell volume flow at each node joining vessel segments and includes known blood rheology. In addition to geometric information, this model required specification of boundary conditions in the form of hematocrit (0.4) and pressure changes between the inlet (75 mmHg) and outlet (50 mmHg) segments. B and C: impact of a 5–15% change in vessel diameter on network blood flow.

References

    1. Akaike N, Kanaide H, Kuga T, Nakamura M, Sadoshima J, Tomoike H. Low-voltage-activated Ca2+ current in rat aorta smooth muscle cells in primary culture. J Physiol 416: 141–160, 1989 - PMC - PubMed
    1. Ball CJ, Wilson DP, Turner SP, Saint DA, Beltrame JF. Heterogeneity of L- and T-channels in the vasculature: rationale for the efficacy of combined L- and T-blockade. Hypertension 53: 654–660, 2009 - PubMed
    1. Bannister RA, Pessah IN, Beam KG. The skeletal L-type Ca2+ current is a major contributor to excitation-coupled Ca2+ entry. J Gen Physiol 133: 79–91, 2009 - PMC - PubMed
    1. Braunstein TH, Inoue R, Cribbs L, Oike M, Ito Y, Holstein-Rathlou NH, Jensen LJ. The role of L- and T-type calcium channels in local and remote calcium responses in rat mesenteric terminal arterioles. J Vasc Res 46: 138–151, 2009 - PubMed
    1. Catterall WA. Structure and function of voltage-gated ion channels. Annu Rev Biochem 64: 493–531, 1995 - PubMed

Publication types

MeSH terms

LinkOut - more resources