. 2013 Jan 15;85(2):173-85.
doi: 10.1016/j.bcp.2012.10.016. Epub 2012 Oct 24.

Ibandronate increases the expression of the pro-apoptotic gene FAS by epigenetic mechanisms in tumor cells

Affiliations

Ibandronate increases the expression of the pro-apoptotic gene FAS by epigenetic mechanisms in tumor cells

R Thaler et al. Biochem Pharmacol. .

Abstract

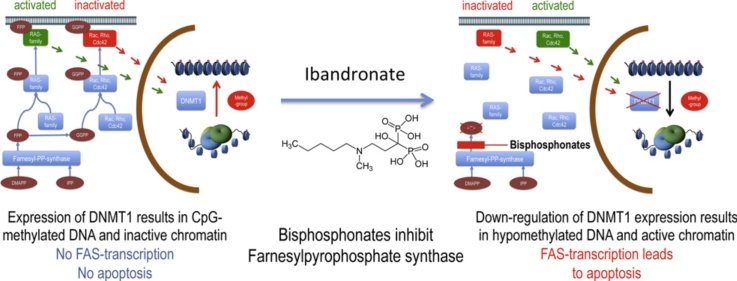
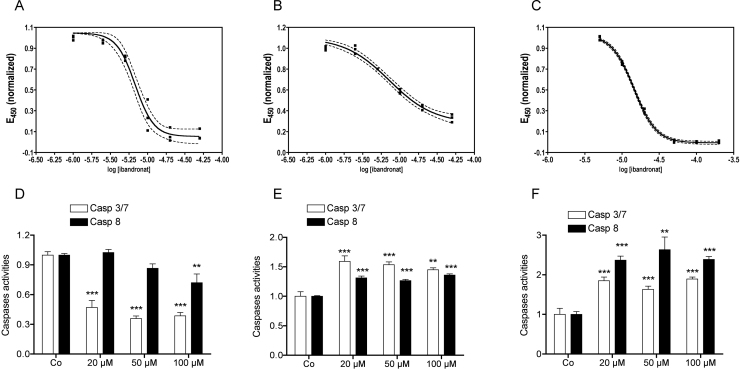
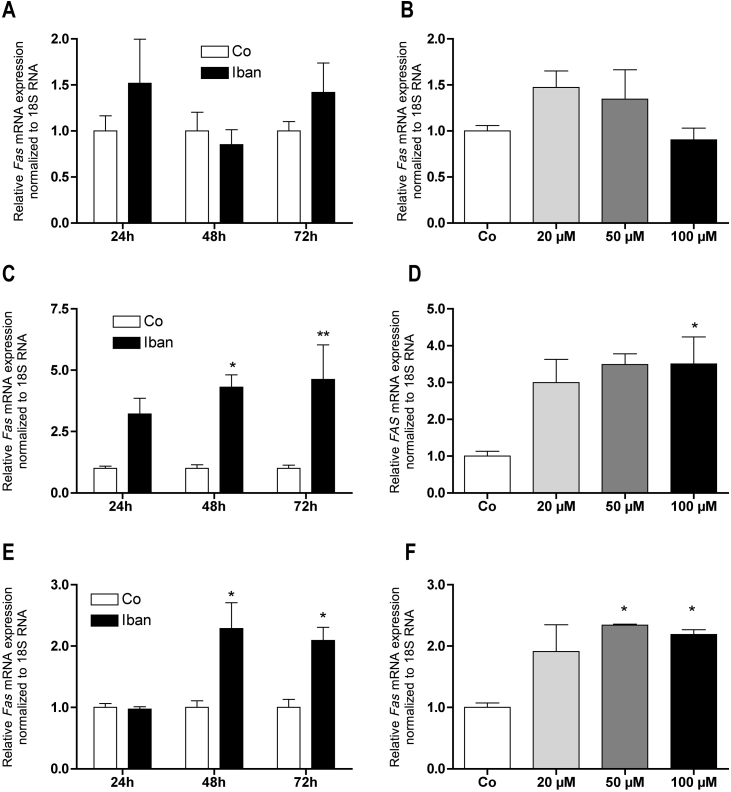
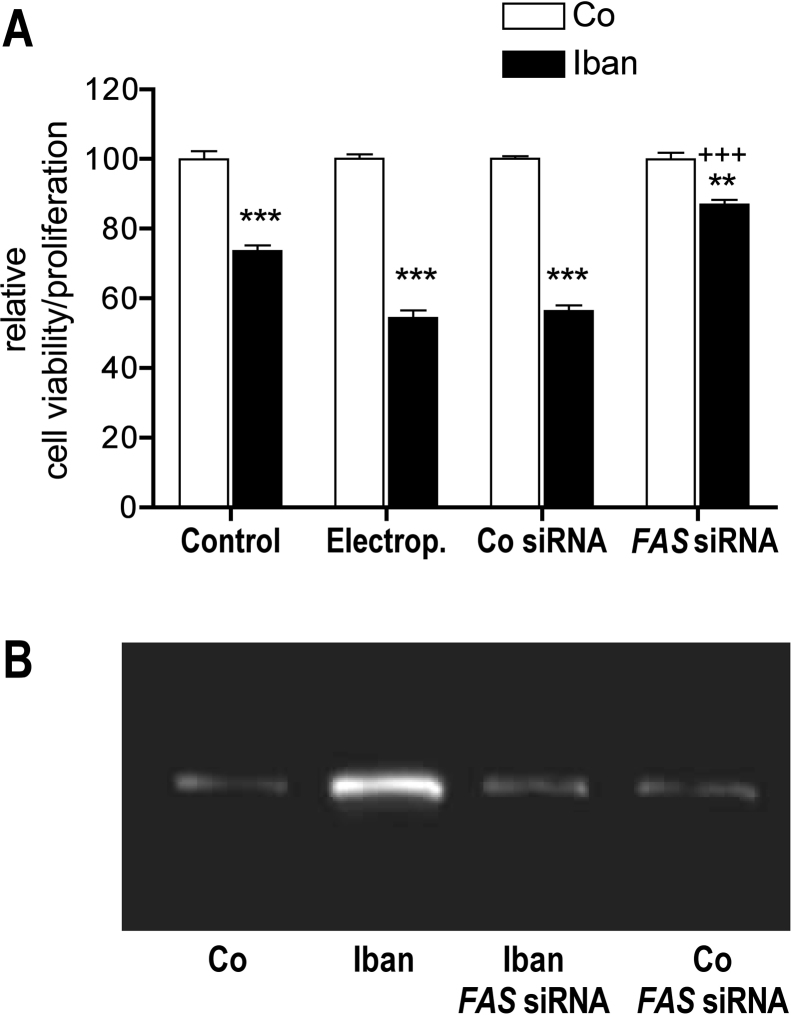
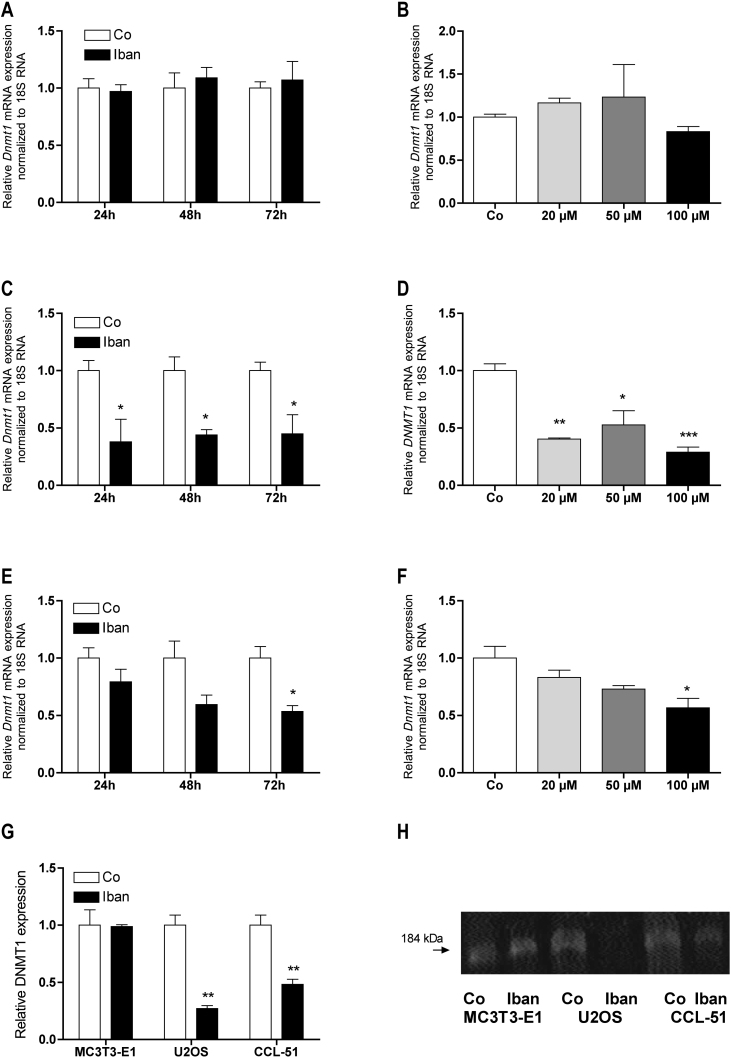
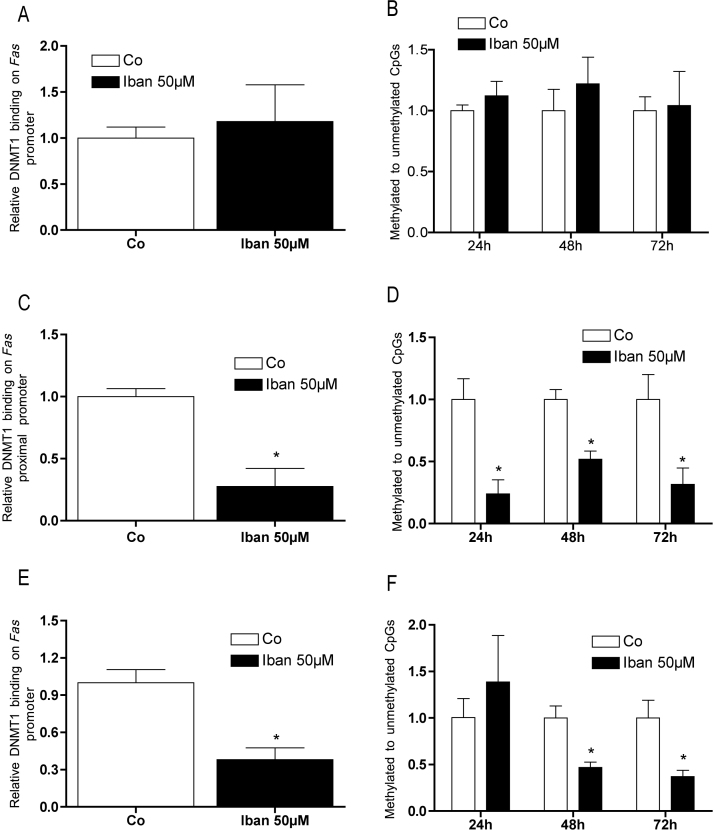
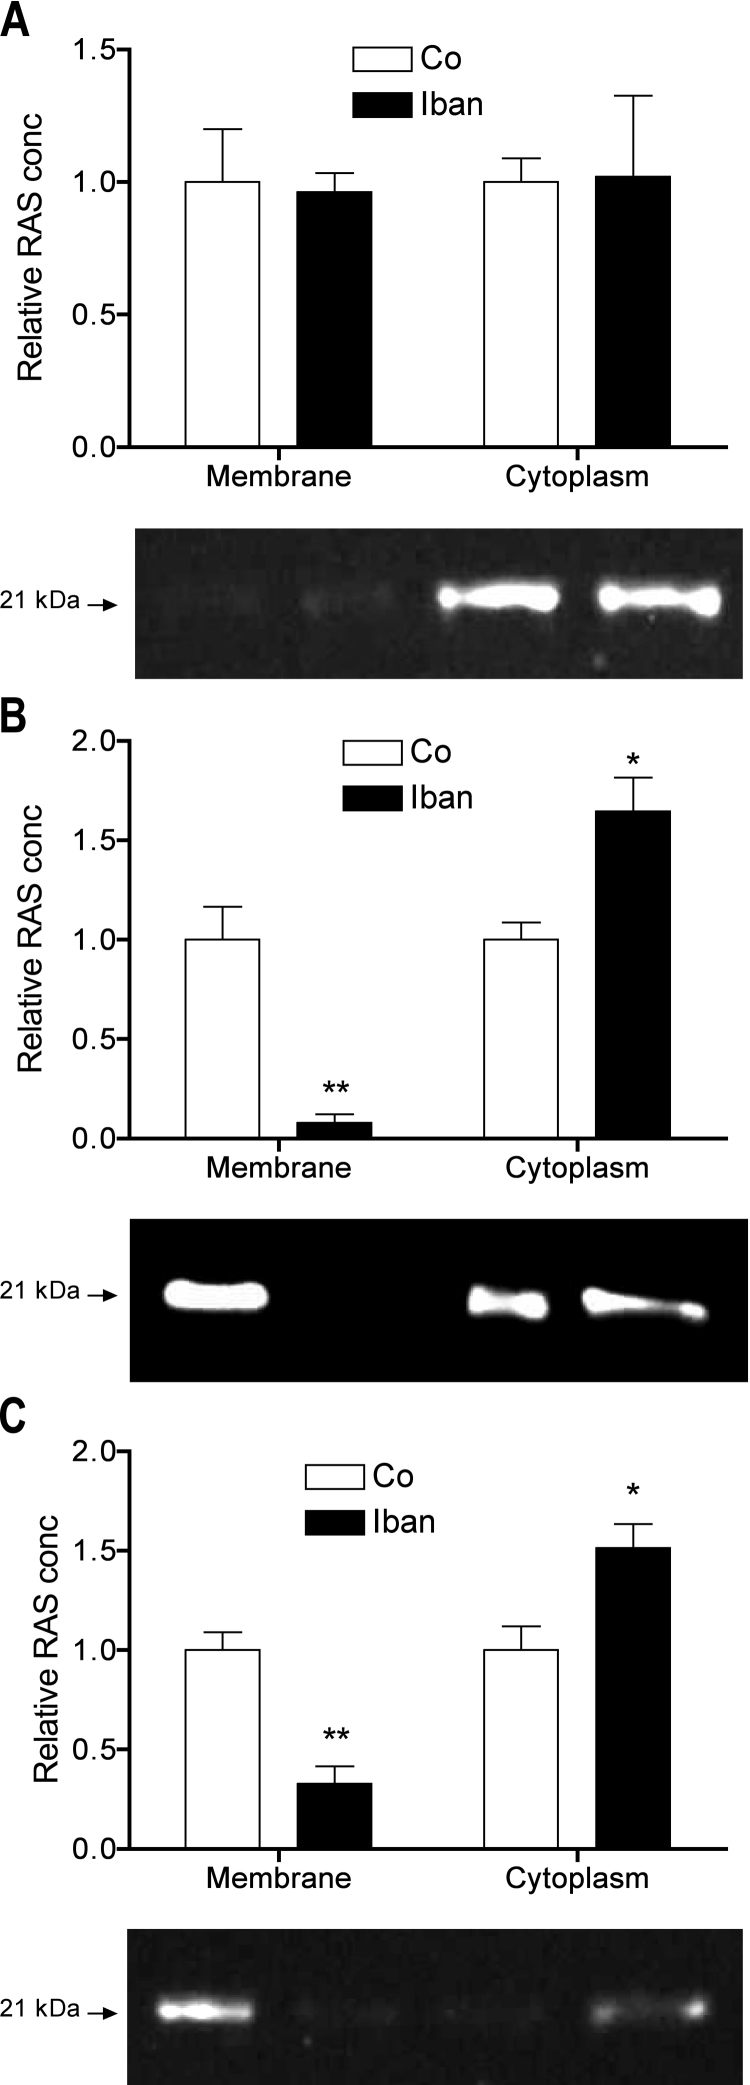
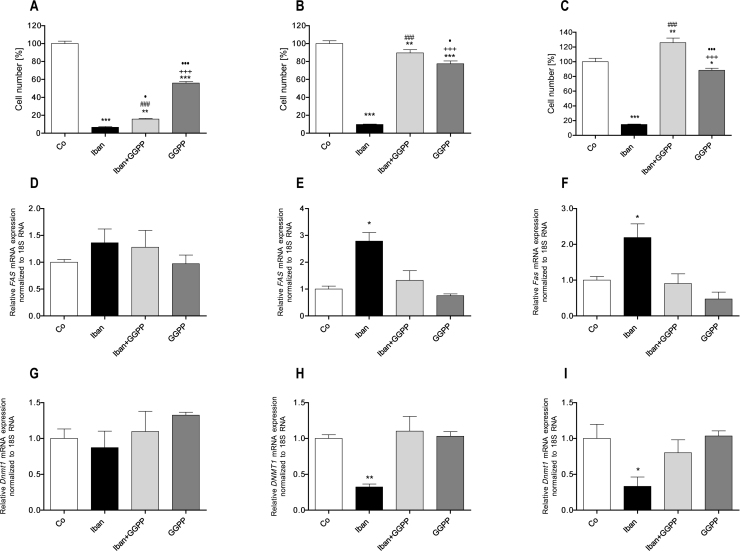
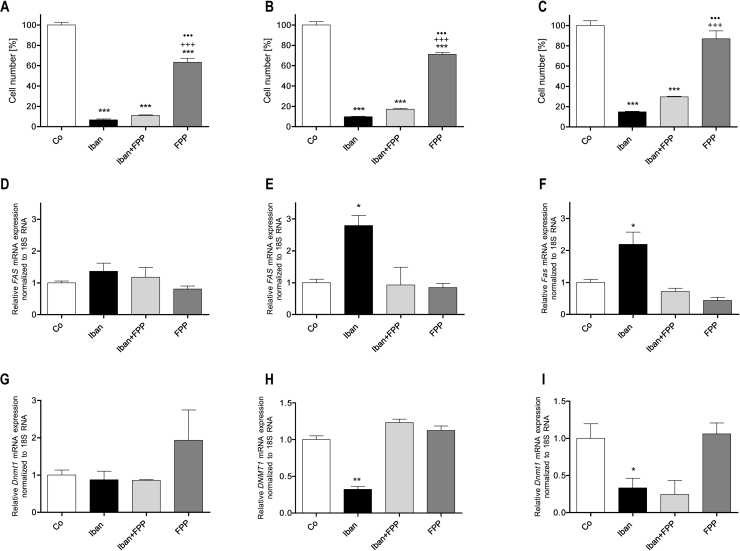
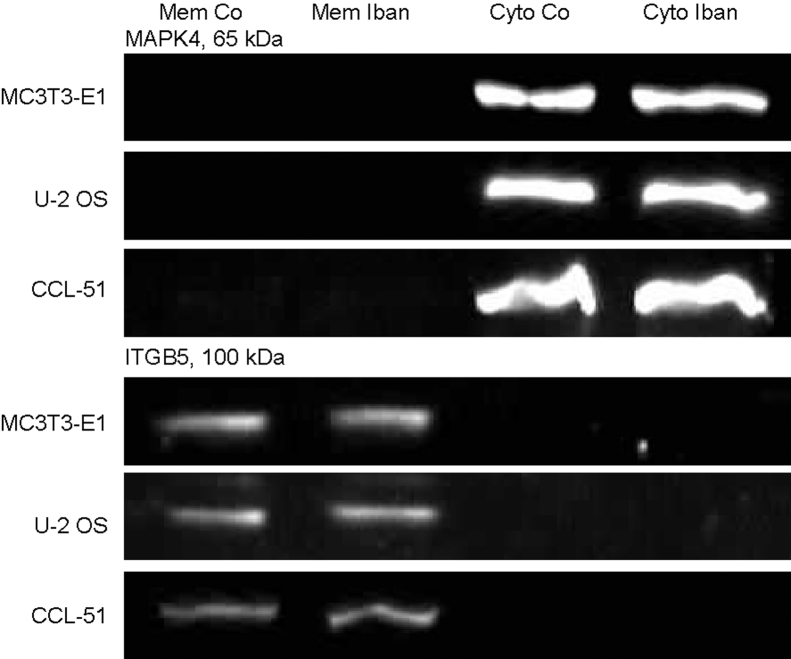
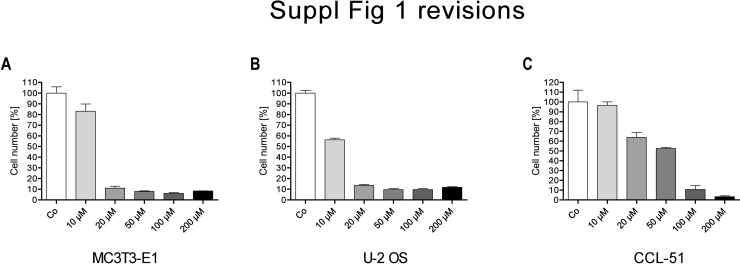
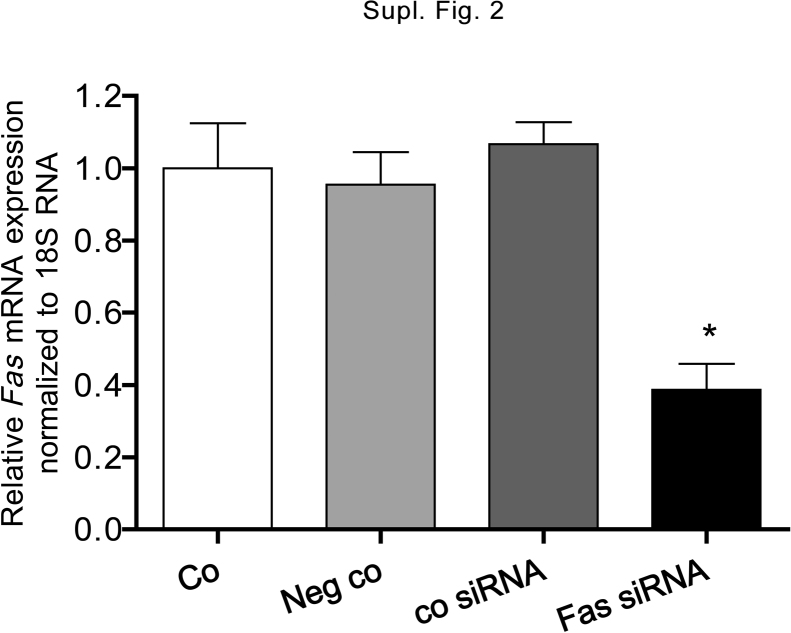
There is growing evidence that aminobisphosphonates like ibandronate show anticancer activity by an unknown mechanism. Biochemically, they prevent posttranslational isoprenylation of small GTPases, thus inhibiting their activity. In tumor cells, activated RAS-GTPase, the founding member of the gene family, down-regulates the expression of the pro-apoptotic gene FAS via epigenetic DNA-methylation by DNMT1. We compared ibandronate treatment in neoplastic human U-2 osteosarcoma and in mouse CCL-51 breast cancer cells as well as in the immortalized non-neoplastic MC3T3-E1 osteoblastic cells. Ibandronate attenuated cell proliferation in all cell lines tested. In the neoplastic cells we found up-regulation of caspases suggesting apoptosis. Further we found stimulation of FAS-expression as a result of epigenetic DNA demethylation that was due to down-regulation of DNMT1, which was rescued by re-isoprenylation by both geranylgeranyl-pyrophosphate and farnesylpyrophosphate. In contrast, ibandronate did not affect FAS and DNMT1 expression in MC3T3-E1 non-neoplastic cells. Data suggest that bisphosphonates via modulation of the activity of small-GTPases induce apoptosis in neoplastic cells by DNA-CpG-demethylation and stimulation of FAS-expression. In conclusion the shown epigenetic mechanism underlying the anti-neoplastic activity of farnesyl-transferase-inhibition, also explains the clinical success of other drugs, which target this pathway.


Figures

None
Graphical abstract
Fig. 1
Fig. 1
Ibandronate attenuated cell viability/proliferation and regulated caspases 3/7 and 8. After 3 days treatment ibandronate attenuated cell multiplication with a half maximal effect (EC50) at 6.8 μM (95% c.i.: 6.00–7.67 μM) in MC3T3-E1 cells (A) and 7.21 μM (95% c.i.: 5.90–8.79 μM) U-2 OS cells (B), while in CCL-51 a slightly higher concentration of 14.4 μM (95% c.i.: 14.0–14.9 μM) (C) was necessary to show the same effect. After the same treatment time, ibandronate down regulated caspase 3/7 in MC3T3-E1 cells significantly already at a concentration of 20 μM, while a significant down-regulation of 8 was found not until a concentration of 100 μM (D). In U-2 OS (E) and CCL-51 (F), however, ibandronate up regulated both caspases at all concentrations tested. Bars represent mean ± SD; **P ≤ 0.01; ***P ≤ 0.001; n = 4.
Fig. 2
Fig. 2
Ibandronate up regulated FAS expression in U-2 OS and CCL-51 but not in MC3T3-E1 cells (A and B). At 100 μM ibandronate up regulated FAS expression in U-2 OS already after 24 h (C) while in CCL-51 not until 48 h (E). In both cell lines the regulation was dose dependent, which reached significance at 100 μM in U-2 OS (D) and at 50 μM in CCL-51 (F). Bars represent mean ± SD; *P ≤ 0.05; **P ≤ 0.01; n = 3.
Fig. 3
Fig. 3
Ibandronate down regulated cell viability/proliferation and up regulated FAS, which could be rescued by transfection of FAS siRNA. (A) After 3 days of treatment with ibandronate (7.2 μM, EC50) cell viability/proliferation was down regulated to 73.6% (control). After electroporation without siRNA ibandronate down regulated cell viability/proliferation to 54.4% (Electrop.) a comparable value, which was found after electroporation of a control siRNA (56.4%, Co siRNA). Electroporation of FAS siRNA resulted in attenuation of down-regulation of cell viability/proliferation to 87.0% demonstrating the FAS regulation on this parameter. The difference of 13.0% suggests a minor second mechanism on regulation of cell viability/proliferation. Bars represent mean ± SD; **P ≤ 0.01; ***P ≤ 0.001; untreated vs. Iban treated; +++P ≤ 0.001; Co siRNA vs. FAS siRNA; n = 3. (B) The immune-blot with anti-FAS antibody demonstrates that Ibandronate up regulated FAS protein expression as well. Transfection with FAS siRNA down regulated ibandronate stimulated FAS protein expression having no considerable effect on basal FAS expression.
Fig. 4
Fig. 4
Ibandronate down regulated DNMT1 expression in U-2 OS and CCL-51 but not in MC3T3-E1 cells (A and B). At 100 μM ibandronate down regulated DNMT1 expression in U-2 OS already after 24 h (C) while in CCL-51 attenuation did not reach significance until 72 h (E). In both cell lines the regulation was dose dependent, which reached significance already at 20 μM in U-2 OS (D) and but not until 100 μM in CCL-51 (F). DNMT1 was also down regulated at the protein level as demonstrated by immuno-blot. Intensity measurements of 3 immune-blots revealed a significant down-regulation only for U-2 OS and CCL-51 cells but not for MC3T3-E1 cells (G). A representative blot is shown in (H). Bars represent mean ± SD; *P ≤ 0.05; **P ≤ 0.01; ***P ≤ 0.001; n = 3.
Fig. 5
Fig. 5
DNMT1 bound to the FAS promoter, which resulted in change of the DNA methylation status in U-2 OS and CCL-51 but not in MC3T3-E1 cells (A and B). 50 μM ibandronate significantly reduced binding of DNMT1 to the promoter of FAS in U-2 OS cells (C) which resulted in a decreased ratio of methylated by unmethylated cytosines already after 24 h (D). In CCL-51 cells ibandronate attenuated binding of DNMT1 to the Fas promoter as well (E) but it decreased methylation not until 48 h treatment (F). Bars represent mean ± SD; *P ≤ 0.05; n = 3.
Fig. 6
Fig. 6
Ibandronate translocated RAS from the membranes to the cytoplasm in U-2 OS (B) and CCL-51 (C) but not in MC3T3-E1 cells (A). Intensity measurements of 3 immune-blots revealed a significant change in the localization of RAS in U-2 OS and CCL-51 cells but not in MC3T3-E1 cells (A). For each cell line a representative blot is shown. Bars represent means normalized to the signal of untreated cells ± SD; *P ≤ 0.05; **P ≤ 0.01; n = 3.
Fig. 7
Fig. 7
Effects of GGPP on ibandronate regulated cell multiplication and expression of FAS and DNMT1. Ibandronate down regulated cell multiplication in all three cell lines tested. In MC3T3-E1 cells, GGPP itself attenuated cell multiplication but could not prevent ibandronate's down-regulation (A). In U-2 OS (B) and CCL-51 (C) cells, GGPP rescued down-regulation of cell multiplication. Moreover, the combination of both drugs increased cell multiplication in CCL-51 cells significantly (C). Neither ibandronate nor GGPP had an effect of Fas (D) and Dnmt1 (G) expression in MC3T3-E1 cells. In U-2 OS cells, GGPP rescued ibandronate's up-regulation of FAS (E) or down-regulation of DNMT1 (H), respectively. Equally, in CCL-51 cells, GGPP rescued ibandronate's up-regulation of Fas (F) or down-regulation of Dnmt1 (I), respectively. Bars represent mean ± SD; *P ≤ 0.05; **P ≤ 0.01; ***P ≤ 0.001 treatment vs. Co; +++P ≤ 0.001 GGPP vs. Ibn; P ≤ 0.05; •••P ≤ 0.001 GGPP vs. Ibn + GGPP; ###P ≤ 0.001 Ibn vs. Ibn + GGPP; n = 3.
Fig. 8
Fig. 8
Effects of FPP on ibandronate regulated cell multiplication and expression of FAS and DNMT1. Ibandronate down regulated cell multiplication in all three cell lines tested. In MC3T3-E1 and U-2 OS cells, FPP itself attenuated cell multiplication (A and B) but had no effect on CCL-51 cells (C). FPP could not rescue cell multiplication in these cell lines. Neither ibandronate nor FPP had an effect on FAS (D) or DNMT1 (G) expression in MC3T3-E1 cells. In U-2 OS cells, FPP rescued ibandronate's up-regulation of FAS (E) or down-regulation of DNMT1 (H), respectively. In CCL-51 cells, FPP rescued ibandronate's up-regulation of Fas (F) but not down-regulation of Dnmt1 (I), respectively. Bars represent mean ± SD; *P ≤ 0.05; ***P ≤ 0.001 treatment vs. Co; +++P ≤ 0.001 FPP vs. Ibn; •••P ≤ 0.001 FPP vs. Ibn + FPP; n = 3.
None
None
None

References

    1. Caraglia M., Santini D., Marra M., Vincenzi B., Tonini G., Budillon A. Emerging anti-cancer molecular mechanisms of aminobisphosphonates. Endocr Relat Cancer. 2006;13:7–26. - PubMed
    1. Baron R., Ferrari S., Russell R.G. Denosumab and bisphosphonates: different mechanisms of action and effects. Bone. 2011;48:677–692. - PubMed
    1. Graaf M.R., Richel D.J., van Noorden C.J., Guchelaar H.J. Effects of statins and farnesyltransferase inhibitors on the development and progression of cancer. Cancer Treat Rev. 2004;30:609–641. - PubMed
    1. Kucukzeybek Y., Gorumlu G., Cengiz E., Karabulut B., Sezgin C., Atmaca H. Apoptosis-mediated cytotoxic effects of ibandronic acid on hormone- and drug-refractory prostate cancer cells and human breast cancer cells. J Int Med Res. 2010;38:1663–1672. - PubMed
    1. Luckman S.P., Hughes D.E., Coxon F.P., Graham R., Russell G., Rogers M.J. Nitrogen-containing bisphosphonates inhibit the mevalonate pathway and prevent post-translational prenylation of GTP-binding proteins, including Ras. J Bone Miner Res. 1998;13:581–589. - PubMed

Publication types

MeSH terms