

Iterative image reconstruction for cerebral perfusion CT using a pre-contrast scan induced edge-preserving prior
- PMID: 23104003
- PMCID: PMC3498910
- DOI: 10.1088/0031-9155/57/22/7519
Iterative image reconstruction for cerebral perfusion CT using a pre-contrast scan induced edge-preserving prior
Abstract
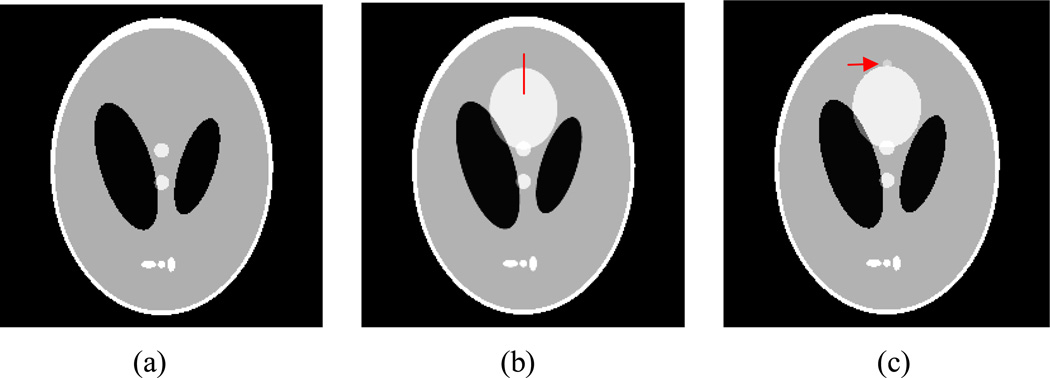
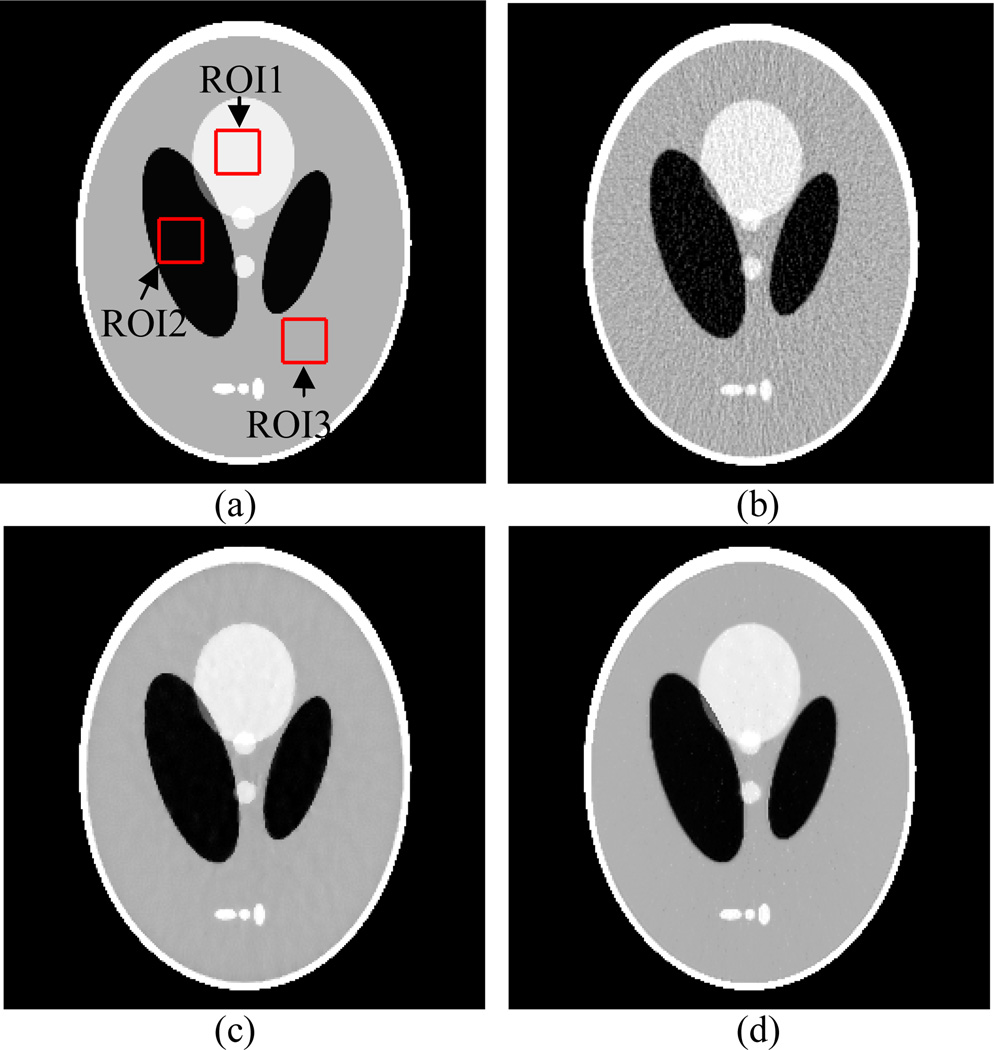
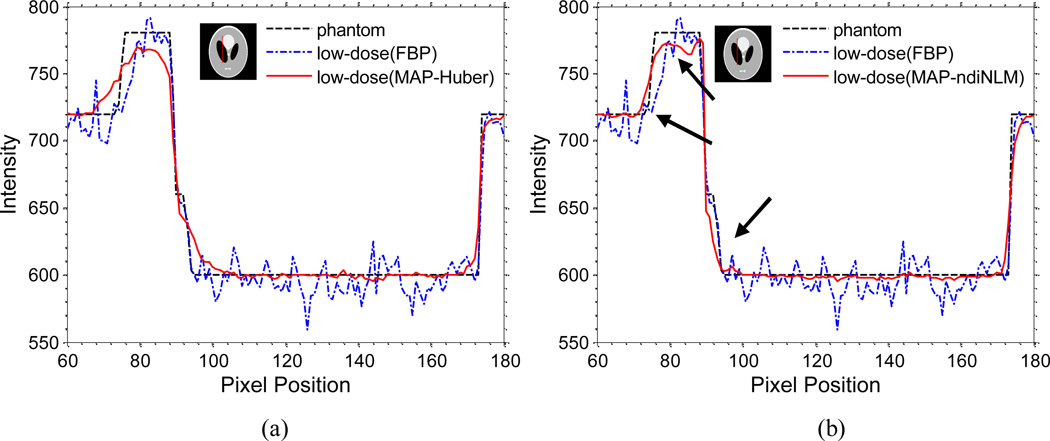
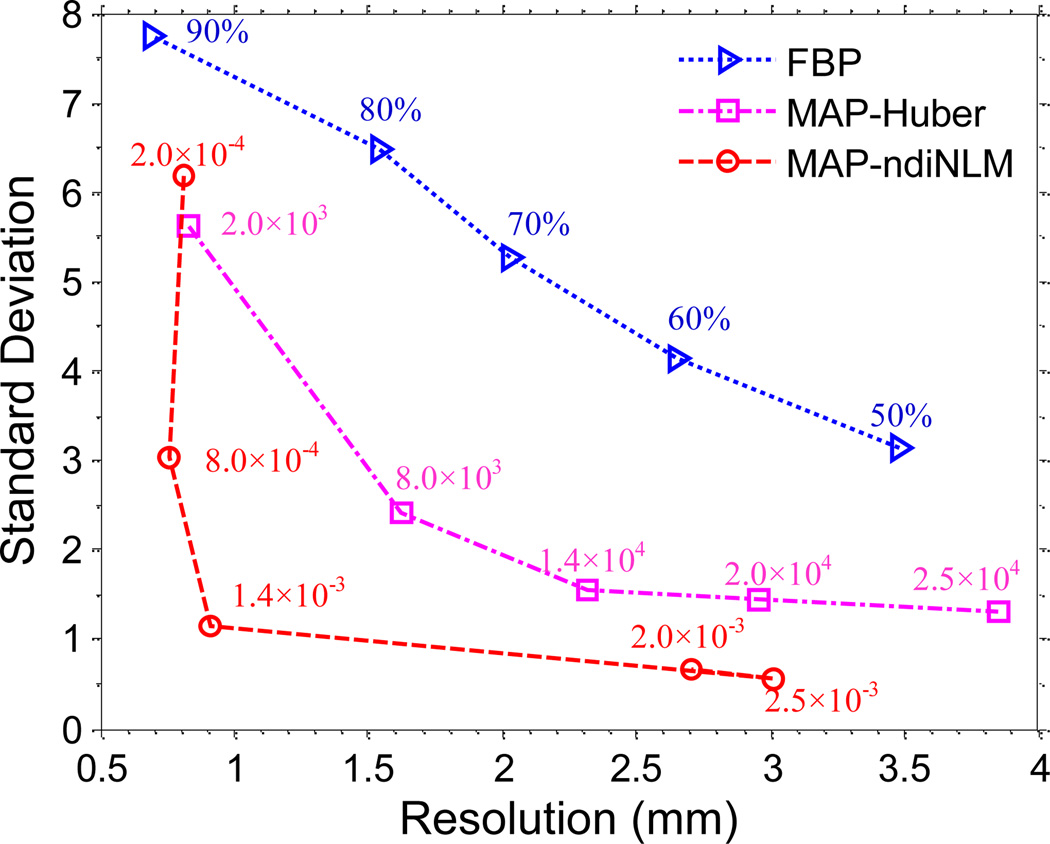
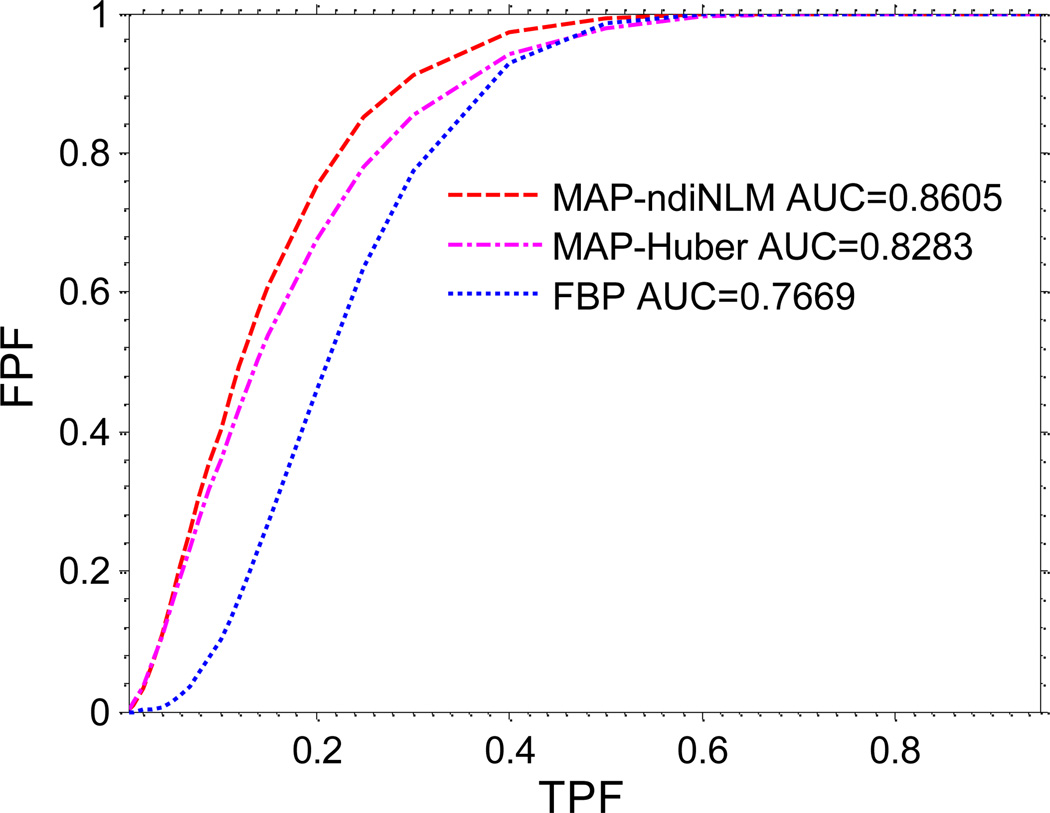
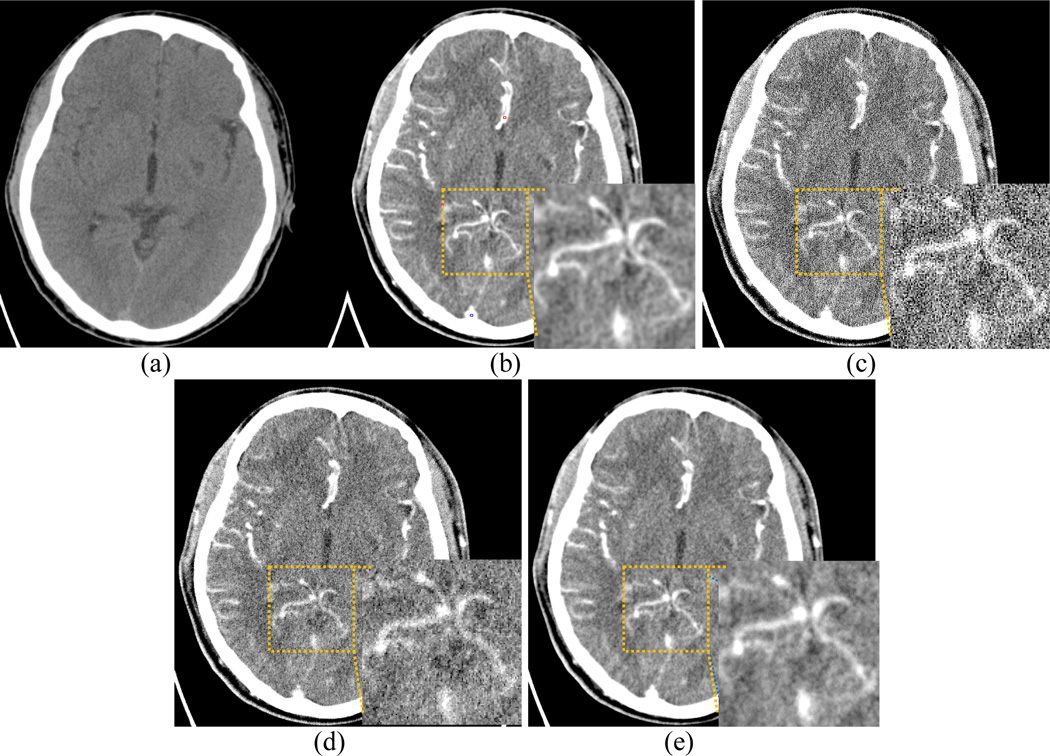
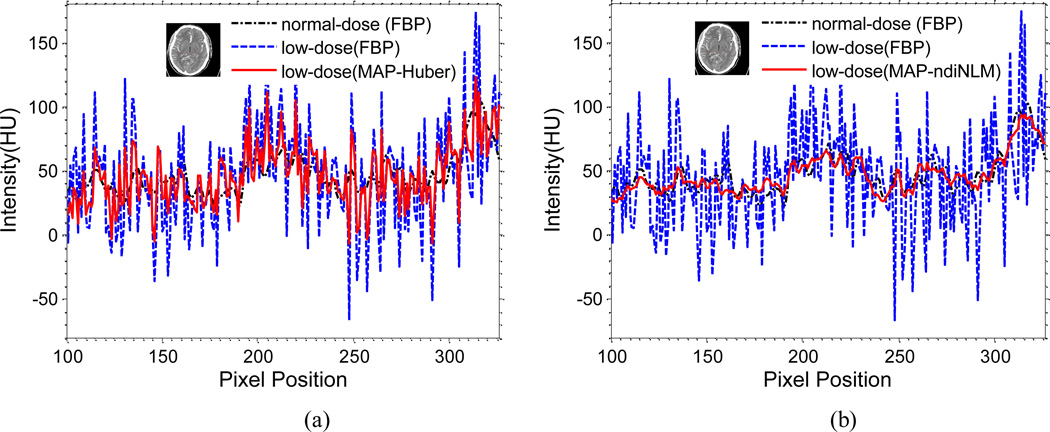
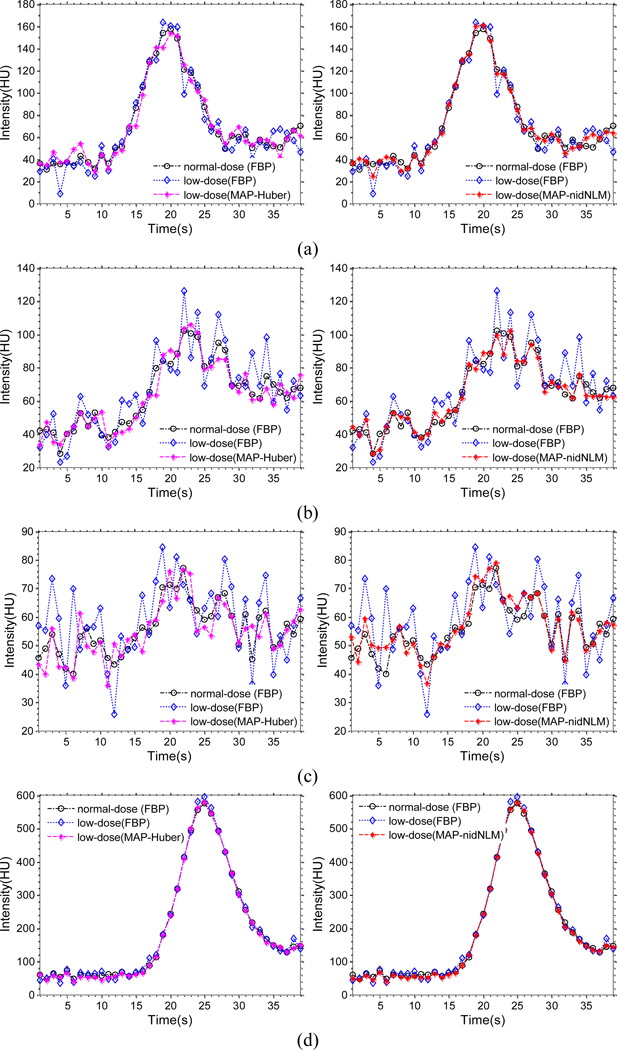
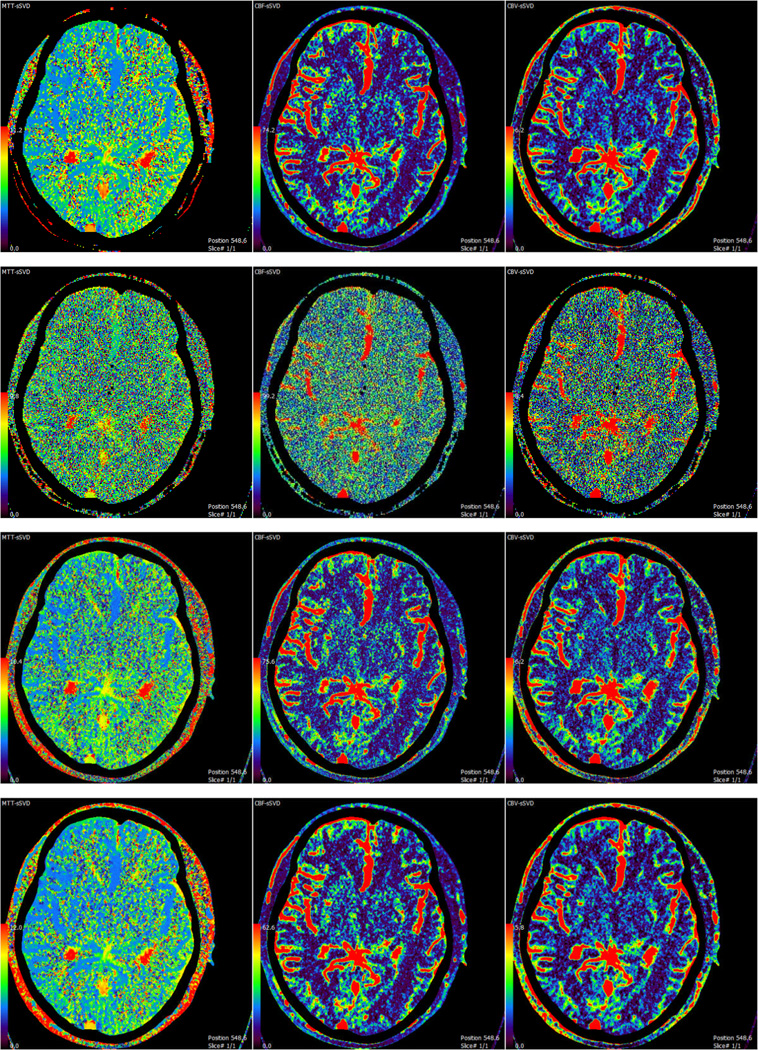
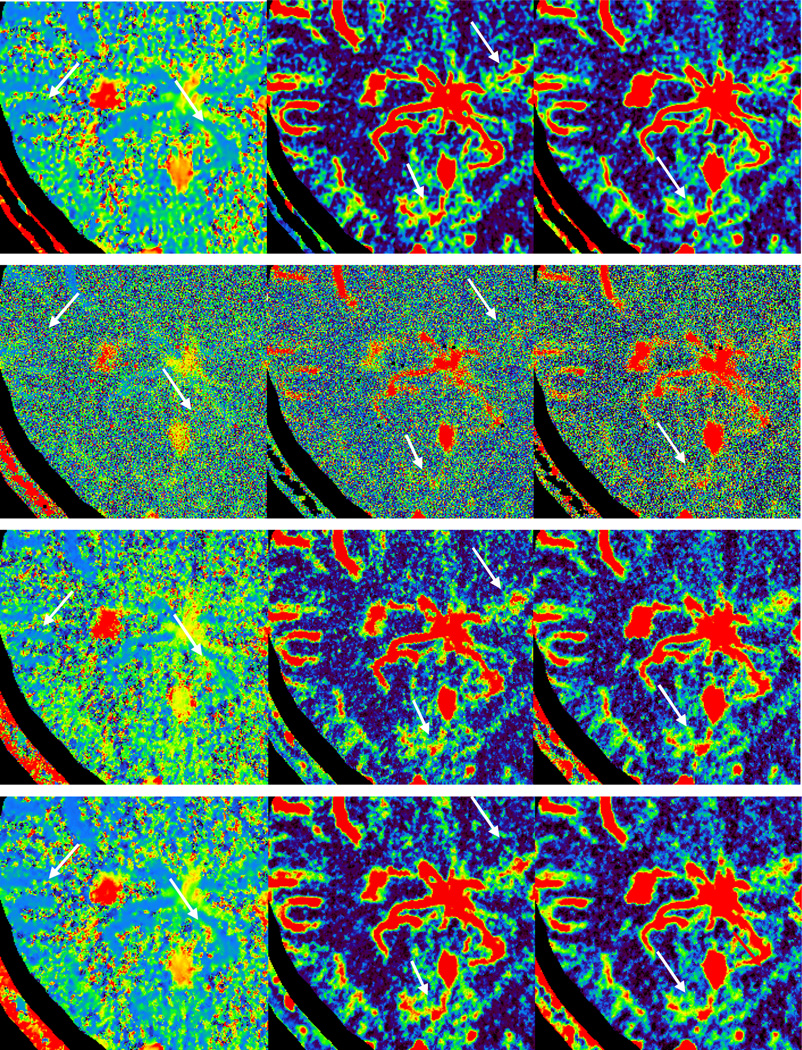
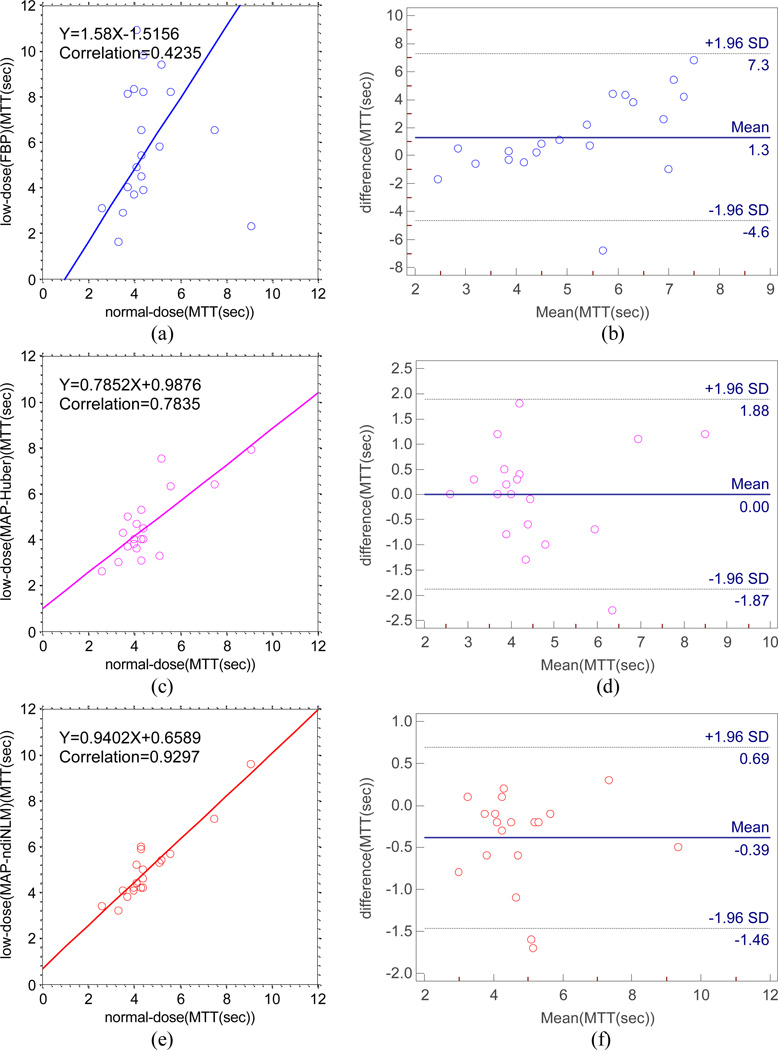
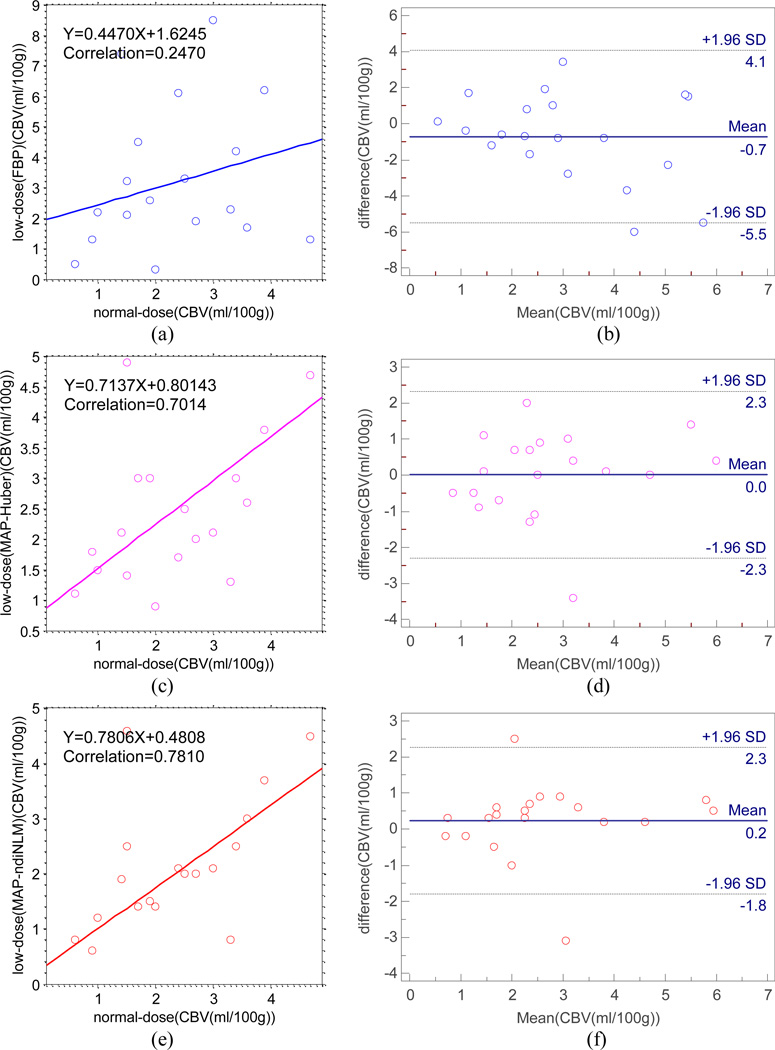
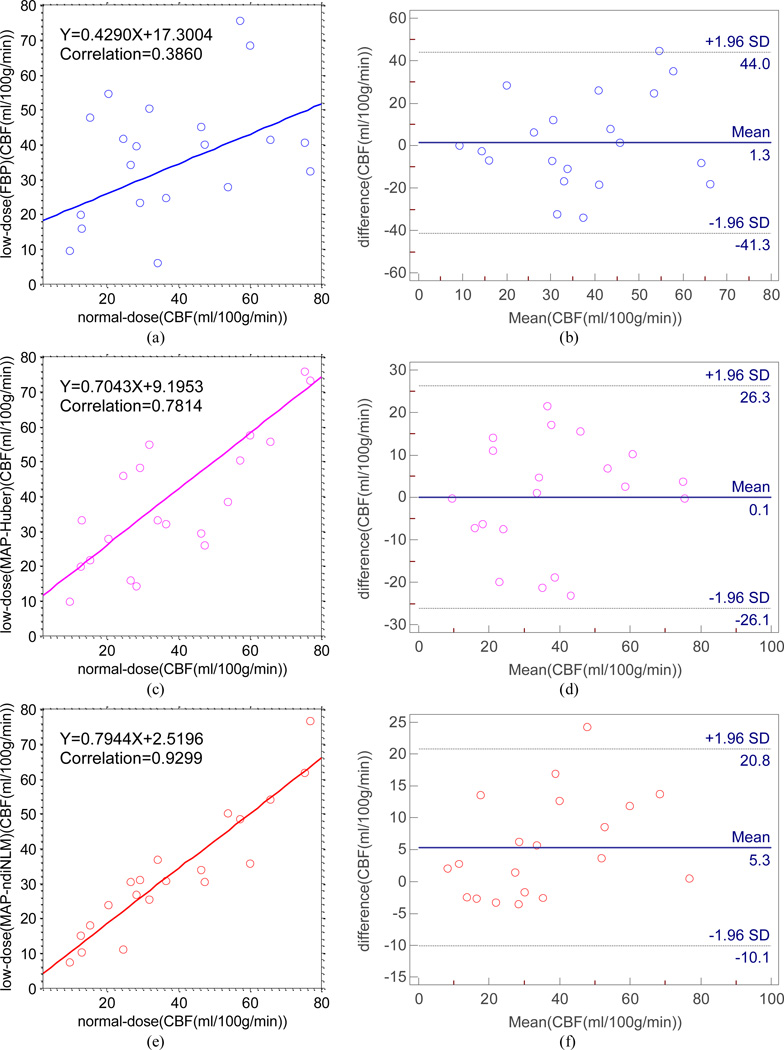
Cerebral perfusion x-ray computed tomography (PCT) imaging, which detects and characterizes the ischemic penumbra, and assesses blood-brain barrier permeability with acute stroke or chronic cerebrovascular diseases, has been developed extensively over the past decades. However, due to its sequential scan protocol, the associated radiation dose has raised significant concerns to patients. Therefore, in this study we developed an iterative image reconstruction algorithm based on the maximum a posterior (MAP) principle to yield a clinically acceptable cerebral PCT image with lower milliampere-seconds (mA s). To preserve the edges of the reconstructed image, an edge-preserving prior was designed using a normal-dose pre-contrast unenhanced scan. For simplicity, the present algorithm was termed as 'MAP-ndiNLM'. Evaluations with the digital phantom and the simulated low-dose clinical brain PCT datasets clearly demonstrate that the MAP-ndiNLM method can achieve more significant gains than the existing FBP and MAP-Huber algorithms with better image noise reduction, low-contrast object detection and resolution preservation. More importantly, the MAP-ndiNLM method can yield more accurate kinetic enhanced details and diagnostic hemodynamic parameter maps than the MAP-Huber method.
Figures
Similar articles
-
Low-dose computed tomography image restoration using previous normal-dose scan.Med Phys. 2011 Oct;38(10):5713-31. doi: 10.1118/1.3638125. Med Phys. 2011. PMID: 21992386 Free PMC article.
-
Cerebral perfusion computed tomography deconvolution via structure tensor total variation regularization.Med Phys. 2016 May;43(5):2091. doi: 10.1118/1.4944866. Med Phys. 2016. PMID: 27147322
-
Adaptive prior image constrained total generalized variation for low-dose dynamic cerebral perfusion CT reconstruction.J Xray Sci Technol. 2024;32(6):1429-1447. doi: 10.3233/XST-240104. J Xray Sci Technol. 2024. PMID: 39302409
-
Iterative reconstruction for low-dose cerebral perfusion computed tomography using prior image induced diffusion tensor.Phys Med Biol. 2021 Jun 3;66(11). doi: 10.1088/1361-6560/ac0290. Phys Med Biol. 2021. PMID: 34081027
-
Radiation dose reduction in perfusion CT imaging of the brain: A review of the literature.J Neuroradiol. 2016 Feb;43(1):1-5. doi: 10.1016/j.neurad.2015.06.003. Epub 2015 Dec 10. J Neuroradiol. 2016. PMID: 26452610 Review.
Cited by
-
SR-NLM: a sinogram restoration induced non-local means image filtering for low-dose computed tomography.Comput Med Imaging Graph. 2013 Jun;37(4):293-303. doi: 10.1016/j.compmedimag.2013.05.004. Epub 2013 Jun 24. Comput Med Imaging Graph. 2013. PMID: 23806509 Free PMC article.
-
[Low-dose CT reconstruction based on high-dimensional partial differential equation projection recovery].Nan Fang Yi Ke Da Xue Xue Bao. 2024 Apr 20;44(4):682-688. doi: 10.12122/j.issn.1673-4254.2024.04.09. Nan Fang Yi Ke Da Xue Xue Bao. 2024. PMID: 38708501 Free PMC article. Chinese.
-
Improving Low-dose Cardiac CT Images based on 3D Sparse Representation.Sci Rep. 2016 Mar 16;6:22804. doi: 10.1038/srep22804. Sci Rep. 2016. PMID: 26980176 Free PMC article.
-
Robust Low-Dose CT Sinogram Preprocessing via Exploiting Noise-Generating Mechanism.IEEE Trans Med Imaging. 2017 Dec;36(12):2487-2498. doi: 10.1109/TMI.2017.2767290. IEEE Trans Med Imaging. 2017. PMID: 29192885 Free PMC article.
-
Statistical image reconstruction for low-dose CT using nonlocal means-based regularization. Part II: An adaptive approach.Comput Med Imaging Graph. 2015 Jul;43:26-35. doi: 10.1016/j.compmedimag.2015.02.008. Epub 2015 Mar 6. Comput Med Imaging Graph. 2015. PMID: 25795593 Free PMC article.
References
-
- Bouman C, Sauer K. A Generalized Gaussian Image Model for Edge-Preserving MAP Estimation. IEEE Trans. Image Process. 1993;2:296–310. - PubMed
-
- Buades A, Coll B, Morel JM. A nonlocal algorithm for image denoising. Proc. IEEE Computer Vision and Pattern Reconization. 2005;2:60–65.
-
- Chan RH, Ho CW, Nikolova M. Convergence of Newton’s method for a minimization problem in impulse noise removal. J. Comp. Math. 2004;22:168–177.
Publication types
MeSH terms
Substances
Grants and funding
LinkOut - more resources
Full Text Sources
Other Literature Sources
Medical
Miscellaneous