Bayesian refinement of association signals for 14 loci in 3 common diseases
- PMID: 23104008
- PMCID: PMC3791416
- DOI: 10.1038/ng.2435
Bayesian refinement of association signals for 14 loci in 3 common diseases
Abstract
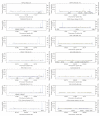
To further investigate susceptibility loci identified by genome-wide association studies, we genotyped 5,500 SNPs across 14 associated regions in 8,000 samples from a control group and 3 diseases: type 2 diabetes (T2D), coronary artery disease (CAD) and Graves' disease. We defined, using Bayes theorem, credible sets of SNPs that were 95% likely, based on posterior probability, to contain the causal disease-associated SNPs. In 3 of the 14 regions, TCF7L2 (T2D), CTLA4 (Graves' disease) and CDKN2A-CDKN2B (T2D), much of the posterior probability rested on a single SNP, and, in 4 other regions (CDKN2A-CDKN2B (CAD) and CDKAL1, FTO and HHEX (T2D)), the 95% sets were small, thereby excluding most SNPs as potentially causal. Very few SNPs in our credible sets had annotated functions, illustrating the limitations in understanding the mechanisms underlying susceptibility to common diseases. Our results also show the value of more detailed mapping to target sequences for functional studies.
Figures

References
-
- Steinman L. Mixed results with modulation of TH-17 cells in human autoimmune diseases. Nat. Immunol. 2010;11:41–44. - PubMed
Publication types
MeSH terms
Substances
Grants and funding
- G9521010/MRC_/Medical Research Council/United Kingdom
- 095552/WT_/Wellcome Trust/United Kingdom
- RG/08/014/24067/BHF_/British Heart Foundation/United Kingdom
- 098051/WT_/Wellcome Trust/United Kingdom
- 090532/WT_/Wellcome Trust/United Kingdom
- ETM/137/CSO_/Chief Scientist Office/United Kingdom
- 091157/WT_/Wellcome Trust/United Kingdom
- G0800675/MRC_/Medical Research Council/United Kingdom
- G0600329/MRC_/Medical Research Council/United Kingdom
- 17552/ARC_/Arthritis Research UK/United Kingdom
- 083948/WT_/Wellcome Trust/United Kingdom
- G0800759/MRC_/Medical Research Council/United Kingdom
- ETM/75/CSO_/Chief Scientist Office/United Kingdom
- G19/9/MRC_/Medical Research Council/United Kingdom
- CZB/4/540/CSO_/Chief Scientist Office/United Kingdom
LinkOut - more resources
Full Text Sources
Other Literature Sources
Medical
Miscellaneous

