

Microsatellites as targets of natural selection
- PMID: 23104080
- PMCID: PMC3548306
- DOI: 10.1093/molbev/mss247
Microsatellites as targets of natural selection
Abstract
The ability to survey polymorphism on a genomic scale has enabled genome-wide scans for the targets of natural selection. Theory that connects patterns of genetic variation to evidence of natural selection most often assumes a diallelic locus and no recurrent mutation. Although these assumptions are suitable to selection that targets single nucleotide variants, fundamentally different types of mutation generate abundant polymorphism in genomes. Moreover, recent empirical results suggest that mutationally complex, multiallelic loci including microsatellites and copy number variants are sometimes targeted by natural selection. Given their abundance, the lack of inference methods tailored to the mutational peculiarities of these types of loci represents a notable gap in our ability to interrogate genomes for signatures of natural selection. Previous theoretical investigations of mutation-selection balance at multiallelic loci include assumptions that limit their application to inference from empirical data. Focusing on microsatellites, we assess the dynamics and population-level consequences of selection targeting mutationally complex variants. We develop general models of a multiallelic fitness surface, a realistic model of microsatellite mutation, and an efficient simulation algorithm. Using these tools, we explore mutation-selection-drift equilibrium at microsatellites and investigate the mutational history and selective regime of the microsatellite that causes Friedreich's ataxia. We characterize microsatellite selective events by their duration and cost, note similarities to sweeps from standing point variation, and conclude that it is premature to label microsatellites as ubiquitous agents of efficient adaptive change. Together, our models and simulation algorithm provide a powerful framework for statistical inference, which can be used to test the neutrality of microsatellites and other multiallelic variants.
Figures
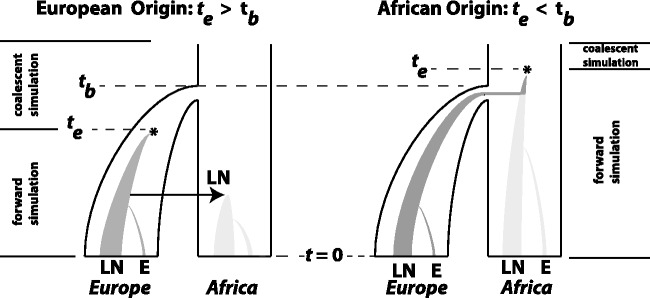
 (left), the bottleneck occurred before the emergence of the first LN allele. In this case, the LN and E alleles observed in Northern Africa on the same haplotypic background as European LN and E alleles can only be explained by back-migration to Africa (arrow). When
  (right), LN emergence takes place in Africa and is subsequently carried to Europe by members of a founding population. Note that only simulations where LN alleles survived to modern day (t = 0) were retained and that the postdivergence African population was not simulated. Coalescent simulation was used to simulate starting distributions of genetic variation; forward simulations as detailed here were used to progress from time te to t = 0.
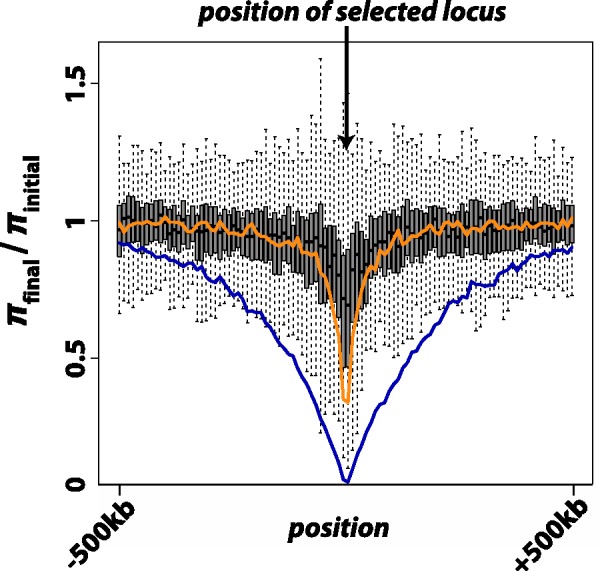
 ), where p0 is the starting frequency of the beneficial SNP variant. The y-axis plots
  , where final nucleotide diversity (
 ) was calculated from a sample of n = 100 chromosomes either at the time of fixation of the beneficial variant (SNP selection) or when mutation-selection-drift equilibrium was achieved (microsatellite selection). In all selection scenarios, the target of selection was located at the center of a 1 Mb sequence. Box plots summarize the results from simulations of microsatellite selection in non-overlapping 10 kb windows (rectangles are interquartile distances). Colored lines plot the mean value of
  across simulations for soft sweep (orange) and hard sweep (blue) simulations.
References
-
- Amos W, Sawcer SJ, Feakes RW, Rubinsztein DC. Microsatellites show mutational bias and heterozygote instability. Nat Genet. 1996;13:390–391. - PubMed
Publication types
MeSH terms
Grants and funding
LinkOut - more resources
Full Text Sources
Miscellaneous
