. 2012 Sep;4(9):695-717.
doi: 10.3390/toxins4090695. Epub 2012 Sep 18.

Aspergillus oxylipin signaling and quorum sensing pathways depend on g protein-coupled receptors

Affiliations

Aspergillus oxylipin signaling and quorum sensing pathways depend on g protein-coupled receptors

Katharyn J Affeldt et al. Toxins (Basel). 2012 Sep.

Abstract

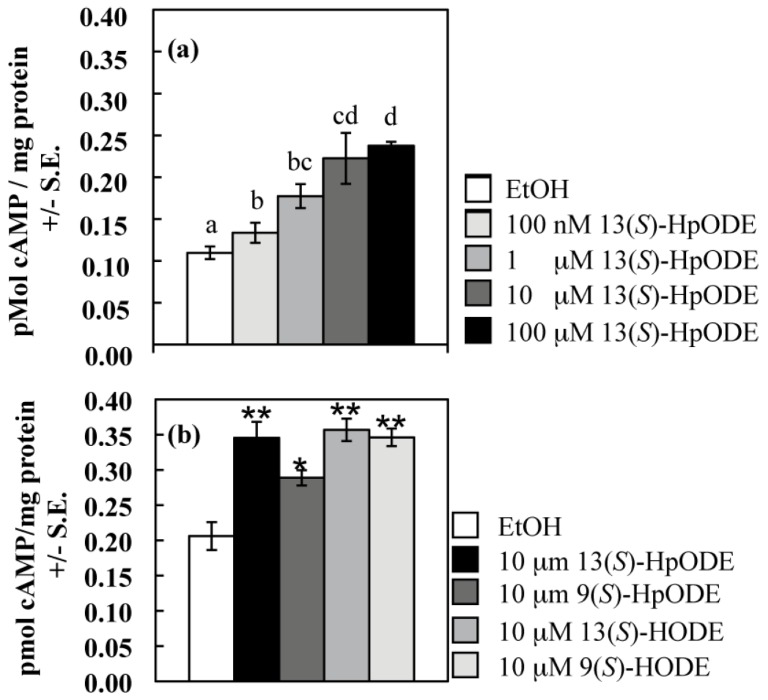
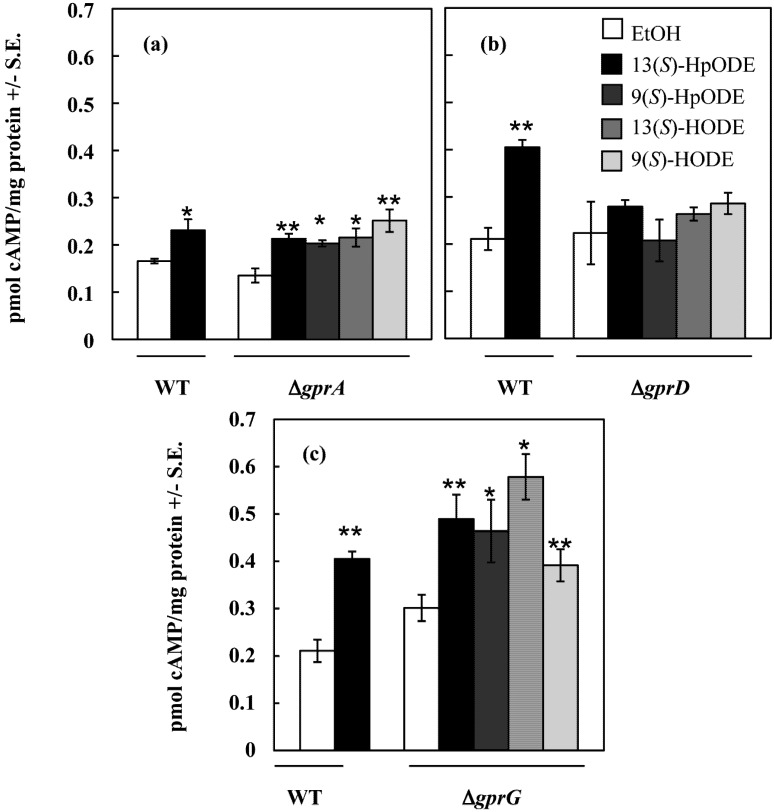
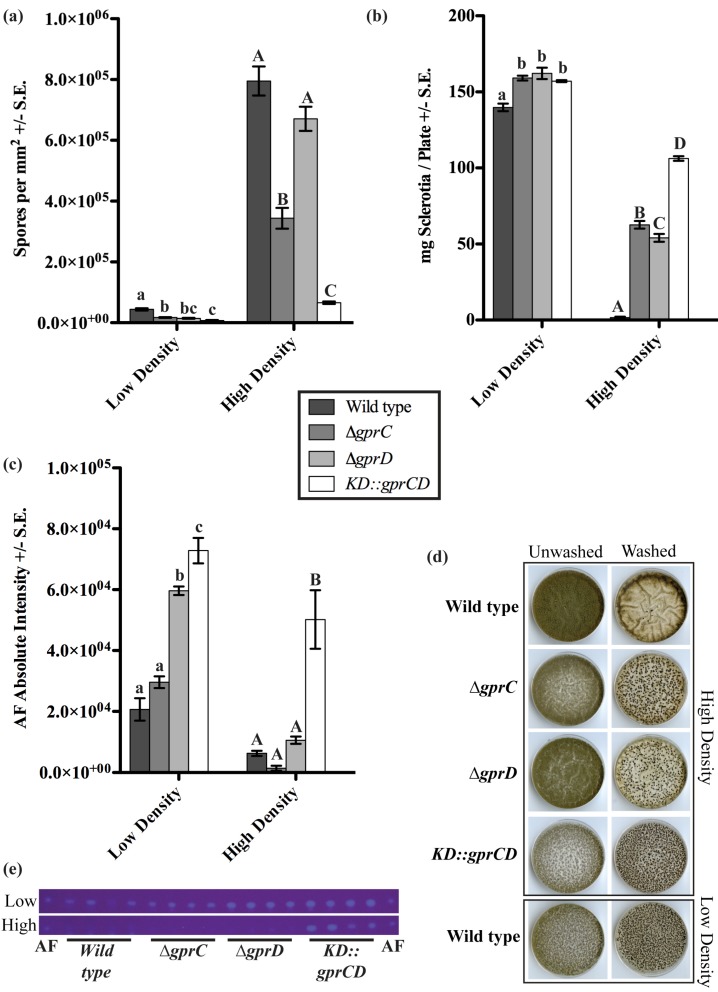
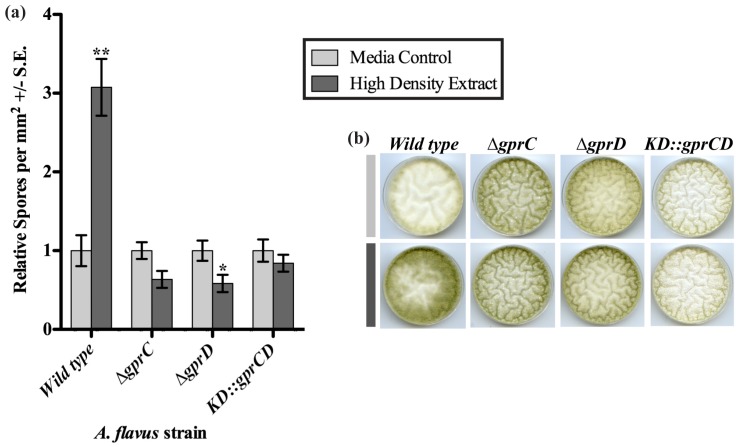
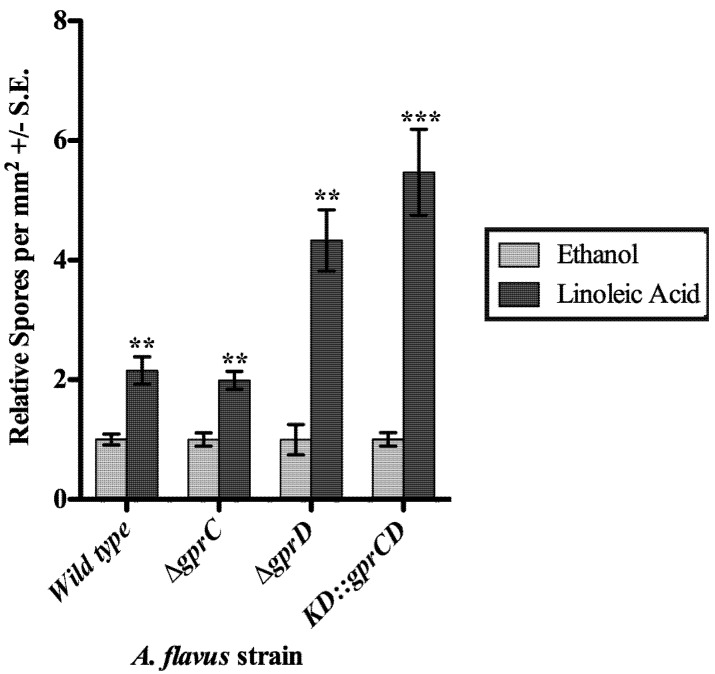
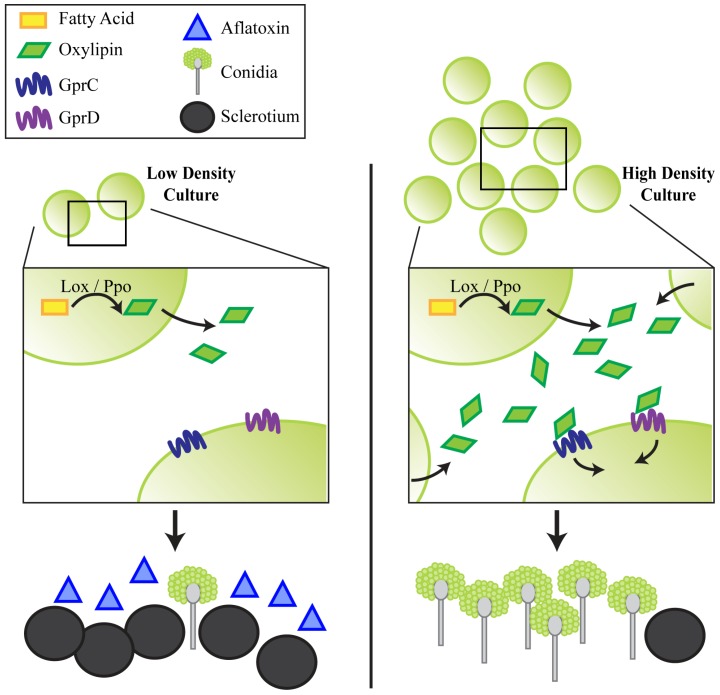
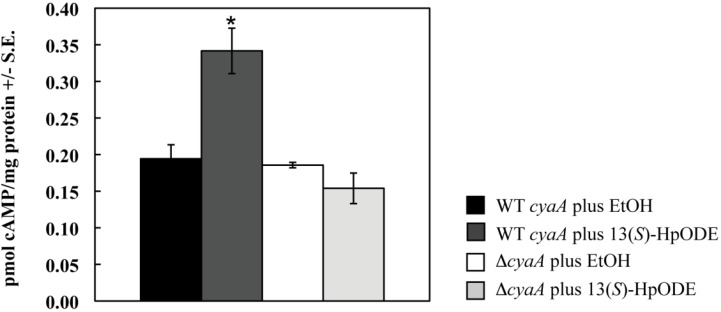
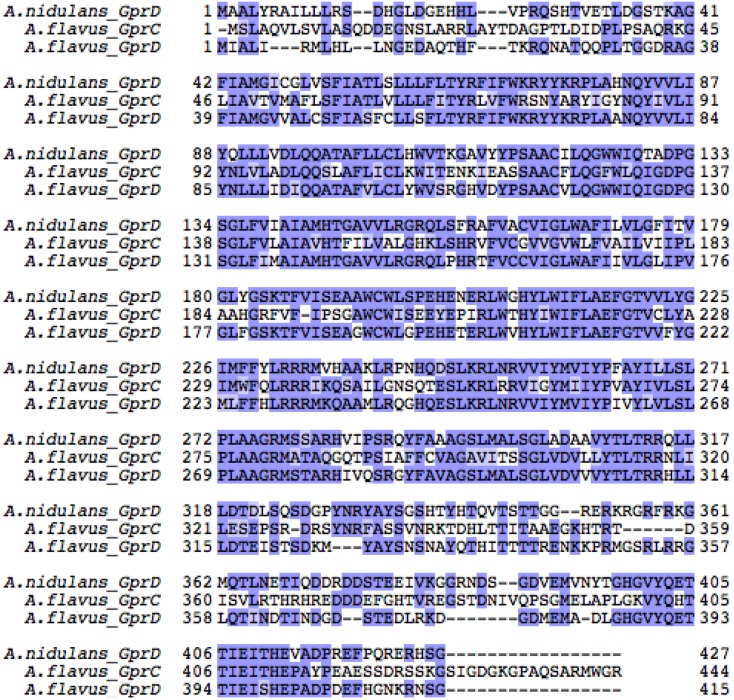
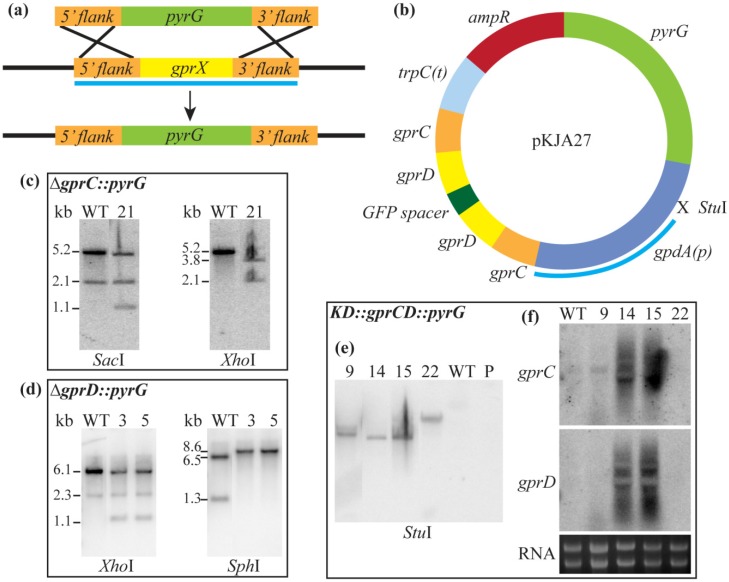
Oxylipins regulate Aspergillus development and mycotoxin production and are also involved in Aspergillus quorum sensing mechanisms. Despite extensive knowledge of how these oxylipins are synthesized and what processes they regulate, nothing is known about how these signals are detected and transmitted by the fungus. G protein-coupled receptors (GPCR) have been speculated to be involved as they are known oxylipin receptors in mammals, and many putative GPCRs have been identified in the Aspergilli. Here, we present evidence that oxylipins stimulate a burst in cAMP in A. nidulans, and that loss of an A. nidulans GPCR, gprD, prevents this cAMP accumulation. A. flavus undergoes an oxylipin-mediated developmental shift when grown at different densities, and this regulates spore, sclerotial and aflatoxin production. A. flavus encodes two putative GprD homologs, GprC and GprD, and we demonstrate here that they are required to transition to a high-density development state, as well as to respond to spent medium of a high-density culture. The finding of GPCRs that regulate production of survival structures (sclerotia), inoculum (spores) and aflatoxin holds promise for future development of anti-fungal therapeutics.

Keywords: Aspergillus; G protein-coupled receptor (GPCR); aflatoxin; oxylipin; quorum sensing; sclerotia.


Figures

Figure 1
Figure 1
(a) Samples were treated with EtOH (control) or an equivalent volume of 13(S)-HpODE dissolved in EtOH to achieve the final sample concentrations listed; (b) Samples were treated with EtOH (control) or an equivalent volume of pure oxylipin dissolved in EtOH to achieve a final sample concentration of 10 μM. For both (a) and (b), tissues were harvested as described, and cAMP concentrations were measured. Differing letters above bars in (a) denote treatments significantly different from one another (p≤ 0.05; one-tailed paired Student’s T-test). Differences from the EtOH control in (b) are denoted as follows: *p < 0.05; **p < 0.01, determined by one-tailed paired Student’s T-tests.
Figure 2
Figure 2
(a) A. nidulans wild type and ∆gprA were treated with EtOH (control) or 10 μM oxylipin in EtOH, tissues were harvested, and cAMP concentrations were measured; (b) A. nidulans wild type and ∆gprD were treated with EtOH (control) or 10 μM oxylipin in EtOH, tissues were harvested, and cAMP concentrations were measured; (c) A. nidulans wild type and ∆gprG were treated with EtOH (control) or 10 μM oxylipin in EtOH, tissues were harvested, and cAMP concentrations were measured. Differences from the EtOH control in (a), (b), and (c) are denoted as follows: *p < 0.05; **p < 0.01, determined by one-tailed paired Student’s T-tests.
Figure 3
Figure 3
(a) Conidia produced by low density and high density cultures were counted; (b) Sclerotia were collected from low density and high density cultures, and their dry weight was measured; (c) Aflatoxin (AF) was extracted from low density and high density cultures, separated by thin layer chromatography (TLC), and visualized under 366-nm light. The absolute intensities of the AF spots were calculated as described in the Experimental section. For all three graphs in (a), (b), and (c), the data were analyzed using one-way ANOVA and a Tukey post-test. Different letters represent statistically significant differences (p < 0.05), with lowercase letters used for low-density data and uppercase letters used for high-density data; (d) A sample of the plates is shown, containing a full set of high-density plates (top four panels) both before (“Unwashed”) and after (“Washed”) washing off conidia. The wild type at low density (lowest panel) is also included for a point of reference; (e) The TLC plates for low and high density cultures are shown here. An AF standard was run on either side of the plates.
Figure 4
Figure 4
(a) Spores were counted from strains grown on plates containing extracts from uninoculated media (light gray bars) or spent medium of high-density wild type cultures (dark gray bars). The spore counts from plates with the media control extract were set to one, and the spore counts from the same strain exposed to the high-density extract were expressed in relation to the media control counts. Differences between the two treatments for each strain are denoted as follows: *p < 0.05; **p < 0.01, determined by two-tailed unpaired Student’s T-tests; (b) A sample of the plates is shown, containing a set of cultures exposed to the media control extract (light gray bar) and a set exposed to the high-density wild type extract (dark gray bar).
Figure 5
Figure 5
Spores were counted from the area of a plate surrounding a disk soaked with ethanol or linoleic acid in ethanol. The counts from the ethanol control disks were set to one, and the spore totals from the same strain exposed to linoleic acid (dark gray bars) were expressed relative to the ethanol control spore counts (light gray bars). Differences between the two treatments for each strain are denoted as follows: *p < 0.05; **p < 0.01; ***p < 0.001, determined by two-tailed unpaired Student’s T-tests.
Figure 6
Figure 6
A hypothetical model is presented in which at low density, cultures of A. flavus produce low amounts of oxylipins (via Ppo and/or Lox enzymes). GprC/D signaling is not activated, and the culture produces AF and sclerotia, but very few conidia. At high density, more oxylipins are produced until their levels exceed a threshold and are recognized by GprC and GprD. This initiates a developmental shift toward conidiation, while very low amounts of sclerotia and AF are produced.
Figure S1
Figure S1
Samples were treated with EtOH (control) or 10 μM 13(S)-HpODE in EtOH. Tissues were harvested as described, and cAMP concentrations were measured. Differences from the EtOH control are denoted as follows: *p < 0.05, determined by a one-tailed paired Student’s T-test.
Figure S2
Figure S2
Amino acid sequences for A. nidulans GprD and A. flavus GprC and GprD were aligned using Clustal Omega [55,56] and Jalview [57,58] with Blosum62 coloring scheme. According to this scheme, gaps are colored white, matching residues are colored dark blue, and non-matching but positively scored residues are colored light blue.
Figure S3
Figure S3
(a) The general scheme for deleting A. flavus gprC and gprD by replacing with pyrG is shown here. The light blue bar represents the region amplified for the Southern probe; (b) The plasmid used to deplete A. flavus gprC and gprD transcripts, pKJA27, is depicted here. The light blue bar represents the region amplified for the Southern probe; (c) The ∆gprC::pyrG strain, TKJA10.1, was confirmed by Southern analysis. Genomic DNA was digested with SacI (WT expected bands: 5.2 and 2.1 kb; ∆gprC expected bands: 4.9, 2.1, and 1.1 kb) and XhoI (WT expected band: 5.2 kb; ∆gprC expected bands: 3.8 and 2.1 kb); (d) The ∆gprD::pyrG strain, TKJA8.1, was confirmed by Southern analysis. Genomic DNA was digested with XhoI (WT expected bands: 6.1 and 2.3 kb; ∆gprD expected bands: 5.8, 2.3, and 1.1 kb) and SphI (WT expected bands: 6.5, 6.1 (faint), and 1.3 kb; ∆gprD expected bands: 8.6 and 6.1 (faint) kb); (e) The KD::gprCD strain, TKJA14.2, was confirmed by Southern analysis. The gpdA promoter is derived from A. nidulans, so the probe will only hybridize if pKJA27 is present. Genomic DNA was digested with StuI (WT and parental strain 3357.5 (denoted “P”) should have no bands; transformants should have one band for each copy of the plasmid they integrated); (f) The KD::gprCD strain, TKJA14.2, was confirmed by Northern analysis. Probes within the coding regions of gprC and gprD were used, and correct transformants were identified by the smear of degraded transcripts, seen for transformants #14 and #15.

References

    1. Squire R.A. Ranking animal carcinogens: A proposed regulatory approach. Science. 1981;214:877–880. - PubMed
    1. Ozturk M. p53 mutation in hepatocellular carcinoma after aflatoxin exposure. Lancet. 1991;338:1356–1359. doi: 10.1016/0140-6736(91)92236-U. - DOI - PubMed
    1. Gouas D., Shi H., Hainaut P. The aflatoxin-induced TP53 mutation at codon 249 (R249S): Biomarker of exposure, early detection and target for therapy. Cancer Lett. 2009;286:29–37. doi: 10.1016/j.canlet.2009.02.057. - DOI - PubMed
    1. Yu J., Cleveland T.E., Nierman W.C., Bennett J.W. Aspergillus flavus genomics: Gateway to human and animal health, food safety, and crop resistance to disease. Rev. Iberoam. Micol. 2005;22:194–202. doi: 10.1016/S1130-1406(05)70043-7. - DOI - PubMed
    1. Lewis L., Onsongo M., Njapau H., Schurz-Rogers H., Luber G., Kieszak S., Nyamongo J., Backer L., Dahiye A.M., Misore A., et al. Aflatoxin contamination of commercial maize products during an outbreak of acute aflatoxicosis in eastern and central Kenya. Environ. Health Perspect. 2005;113:1763–1767. - PMC - PubMed

Publication types

MeSH terms

LinkOut - more resources