. 2012 Dec;45(6):545-56.
doi: 10.1111/j.1365-2184.2012.00847.x.

The mechanisms of nadroparin-mediated inhibition of proliferation of two human lung cancer cell lines

Affiliations

The mechanisms of nadroparin-mediated inhibition of proliferation of two human lung cancer cell lines

Y Carmazzi et al. Cell Prolif. 2012 Dec.

Abstract

Objectives: Clinical data suggest that heparin treatment improves survival of lung cancer patients, but the mechanisms involved are not fully understood. We investigated whether low molecular weight heparin nadroparin, directly affects lung cancer cell population growth in conventionally cultured cell lines.

Materials and methods: A549 and CALU1 cells' viability was assessed by MTT and trypan blue exclusion assays. Cell proliferation was assessed using 5-bromo-2-deoxyuridine incorporation. Apoptosis and cell-cycle distribution were analysed by flow cytometry; cyclin B1, Cdk1, p-Cdk1 Cdc25C, p-Cdc25C and p21 expressions were analysed by western blotting. mRNA levels were analysed by real time RT-PCR.

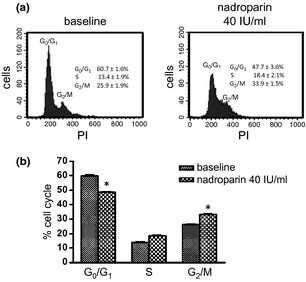
Results: Nadroparin inhibited cell proliferation by 30% in both cell lines; it affected the cell cycle in A549, but not in CALU-1 cells, inducing arrest in the G(2) /M phase. Nadroparin in A549 culture inhibited cyclin B1, Cdk1, Cdc25C and p-Cdc25C, while levels of p-Cdk1 were elevated; p21 expression was not altered. Dalteparin caused a similar reduction in A549 cell population growth; however, it did not alter cyclin B1 expression as expected, based on previous reports. Fondaparinux caused minimal inhibition of A549 cell population growth and no effect on either cell cycle or cyclin B1 expression.

Conclusions: Nadroparin inhibited proliferation of A549 cells by inducing G(2) /M phase cell-cycle arrest that was dependent on the Cdc25C pathway, whereas CALU-1 cell proliferation was halted by as yet not elucidated modes.


Conflict of interest statement

None of the authors have conflicts of interest to disclose.

Figures

Figure 1
Figure 1
Kinetics (a) and dose–response analysis (b) of effects of nadroparin treatment of A549 cell population growth in MTT reduction assay, and effect of nadroparin on A549 cell population growth determined by trypan blue dye exclusion assay (c) and on A549 cell proliferation determined by BrdU incorporation (d). (a) Cells treated with nadroparin at 5 (●), 10 (▲), 20 (▼) and 40 (♦) IU/ml for 24, 48 and 72 h; (b) Cells treated with nadroparin at different concentrations for 48 h. Data expressed as mean ± SEM of three independent experiments, each performed in quadruplicate. *< 0.05 and **< 0.01 for 20 and 40 IU/ml, respectively, versus untreated cells (ANOVA). (c and d) Cells treated with nadroparin at 40 IU/ml for 48 h. Data are representative of three independent experiments, each performed in quadruplicate. *< 0.05 for 40 IU/ml nadroparin‐treated versus ‐untreated cells (Student's t‐test).
Figure 2
Figure 2
Effect of nadroparin treatment on A549 apoptosis induction, as assessed by flow cytometric analysis. (a) Scatterplots from one representative experiment; (b) Mean ± SEM from three independent experiments *< 0.05 cisplatin versus untreated cells (ANOVA).
Figure 3
Figure 3
Effect of 48 h nadroparin treatment on A549 cell cycle distribution as assessed by flow cytometric analysis. (a) Histograms from one representative experiment; (b) Mean ± SEM from three independent experiments. *< 0.05 for nadroparin‐treated versus ‐untreated cells for both G0/G1 and G2/M phases (Student's t‐test).
Figure 4
Figure 4
Western blot analysis of the effect of nadroparin on cyclin B1 (a) protein levels and analysis of cyclin B1 (b) mRNA expression in A549 cells. (a) Effect of nadroparin on cyclin B1 protein levels. Blot is representative of three independent experiments. For densitometric analysis of resulting bands, these were quantified using IMAGEJ; data are mean ± SEM from all three experiments. *< 0.05 for nadroparin (40 IU/ml)‐treated versus ‐untreated cells (ANOVA); (b) Effect of nadroparin on cyclin B1 mRNA expression. Data are mean ± SEM from three independent experiments. **< 0.01 for nadroparin (40 IU/ml)‐treated versus ‐untreated cells (ANOVA); ***< 0.0001 for colchicine‐treated versus ‐untreated cells (ANOVA).
Figure 5
Figure 5
Western blot analysis of the effect of nadroparin on Cdk1 (a), p‐Cdk1 (b), Cdc25C (d) and p‐Cdc25C (e) protein levels and analysis of Cdk1 (c) and Cdc25C (f) mRNA expression in A549 cells. (a) Effect of nadroparin on Cdk1 protein levels. Blot is representative of three independent experiments. For densitometric analysis, resulting bands were quantified using IMAGEJ; data are mean ± SEM from all three experiments. **< 0.01 for nadroparin (40 IU/ml) and colchicine‐treated versus ‐untreated cells (ANOVA); (b) Effect of nadroparin on p‐Cdk1 protein levels. The blot is representative of three independent experiments. For densitometric analysis, resulting bands were quantified using IMAGEJ; data are mean ± SEM from all three experiments. ***< 0.0001 for nadroparin (40 IU/ml)‐treated versus ‐untreated cells (ANOVA); **< 0.01 for colchicine‐treated versus ‐untreated cells (ANOVA); (c) Effect of nadroparin on Cdk1 mRNA expression. Data are mean ± SEM from three independent experiments. *< 0.05 for nadroparin (40 IU/ml) and colchicine‐treated versus ‐untreated cells (ANOVA); (d) Effect of nadroparin on Cdc25C protein levels. Blot is representative of three independent experiments. For densitometric analysis, resulting bands were quantified using IMAGEJ; data are mean ± SEM from all three experiments. *< 0.05 for nadroparin (40 IU/ml) and colchicine‐treated versus ‐untreated cells (ANOVA); (e) Effect of nadroparin on p‐Cdc25C protein levels. Blot is representative of three independent experiments. For densitometric analysis, resulting bands were quantified using IMAGEJ; data are mean ± SEM from all three experiments. **< 0.01 for nadroparin (40 IU/ml) and colchicine‐treated versus ‐untreated cells (ANOVA); (f) Effect of nadroparin on Cdc25C mRNA expression. Data are mean ± SEM from three independent experiments. *< 0.05 for nadroparin (40 IU/ml)‐treated versus ‐untreated cells (ANOVA); **< 0.01 for colchicine‐treated versus ‐untreated cells (ANOVA).
Figure 6
Figure 6
Western blot analysis of the effect of nadroparin on p21 protein levels in A549 cells. Effect of nadroparin on p21 protein levels. Blot is representative of three independent experiments. For densitometric analysis, the resulting bands were quantified using IMAGEJ; data are mean ± SEM from all three experiments. ***< 0.0001 for nadroparin (40 IU/ml) and colchicine‐treated versus ‐untreated cells (ANOVA).
Figure 7
Figure 7
Effect of dalteparin versus nadroparin on cyclin B1 protein levels. Blot is representative of three independent experiments. For densitometric analysis, resulting bands were quantified using IMAGEJ; data are mean ± SEM from three independent experiments. *< 0.05 for nadroparin (40 IU/ml)‐treated versus ‐untreated cells (Student's t‐test).
Figure 8
Figure 8
Effect of 48 h nadroparin treatment on CALU ‐1 cell cycle distribution as assessed by flow cytometric analysis. (a) Histograms from one representative experiment; (b) Mean ± SEM from three independent experiments.
Figure 9
Figure 9
Western blot analysis of the effect of nadroparin on cyclin B1 (a) and Cdk1 (c) in CALU‐1 cell line. (a) Effect of nadroparin on cyclin B1 protein levels after treatment with 40 IU/ml nadroparin for 48 h. Blot is representative of three independent experiments; (b) Densitometric analysis of resulting bands. Bands were quantified using IMAGEJ; data are mean ± SEM from three independent experiments. (c) Effect of nadroparin on Cdk1 protein levels after treatment with 40 IU/ml nadroparin for 48 h. Blot is representative of three independent experiments; (d) Densitometric analysis of resulting bands. Bands were quantified using IMAGEJ; data are mean ± SEM from three independent experiments.
Figure 10
Figure 10
Dose–response effect of fondaparinux on A549 cell population growth (a) determined by MTT assay and western blot analysis on cyclin B1 levels in A549 cell line (b and c). (a) Cells were treated with fondaparinux for 24 h (‐‐▲‐‐) and 48 h (—●—). Data are mean ± SEM of three independent experiments, each performed in quadruplicate. (b) Effect of fondaparinux on cyclin B1 protein levels after treatment with 40 IU/ml fondaparinux for 48 h. Blot is representative of three independent experiments; (c) Densitometric analysis of resulting bands. Bands were quantified using IMAGEJ; data are mean ± SEM from three independent experiments.

Similar articles

Cited by

References

    1. Jemal A, Siegel R, Ward E, Hao Y, Xu J, Thun MJ (2009) Cancer statistics, 2009. CA Cancer J. Clin. 59, 225–249. - PubMed
    1. Molina JR, Adjei AA, Jett JR (2006) Advances in chemotherapy of non‐small cell lung cancer. Chest 130, 1211–1219. - PubMed
    1. Herbst RS, Heymach JV, Lippman SM (2008) Lung cancer. N. Engl. J. Med. 359, 1367–1380. - PMC - PubMed
    1. Kakkar AK, Levine MN, Kadziola Z, Lemoine NR, Low V, Patel HK et al (2004) Low molecular weight heparin, therapy with dalteparin, and survival in advanced cancer: the fragmin advanced malignancy outcome study (FAMOUS). J. Clin. Oncol. 22, 1944–1948. - PubMed
    1. Altinbas M, Coskun HS, Er O, Ozkan M, Eser B, Unal A et al (2004) A randomized clinical trial of combination chemotherapy with and without low‐molecular‐weight heparin in small cell lung cancer. J. Thromb. Haemost. 2, 1266–1271. - PubMed

MeSH terms