. 2013 Jan;124(1):79-89.
doi: 10.1111/jnc.12063. Epub 2012 Nov 15.

Sleep/wake dependent changes in cortical glucose concentrations

Affiliations

Sleep/wake dependent changes in cortical glucose concentrations

Michael B Dash et al. J Neurochem. 2013 Jan.

Abstract

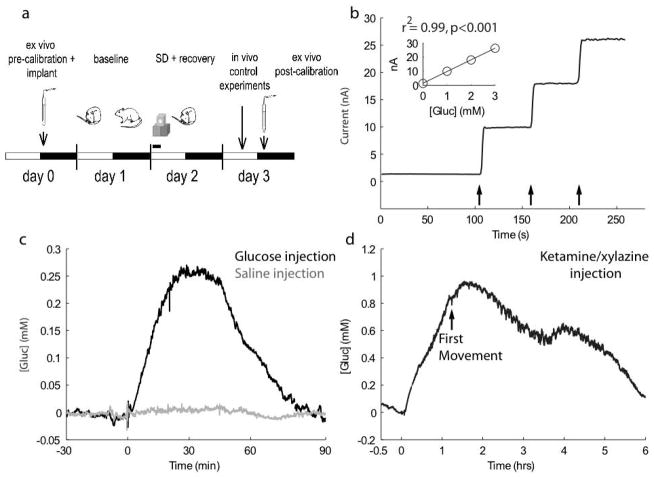
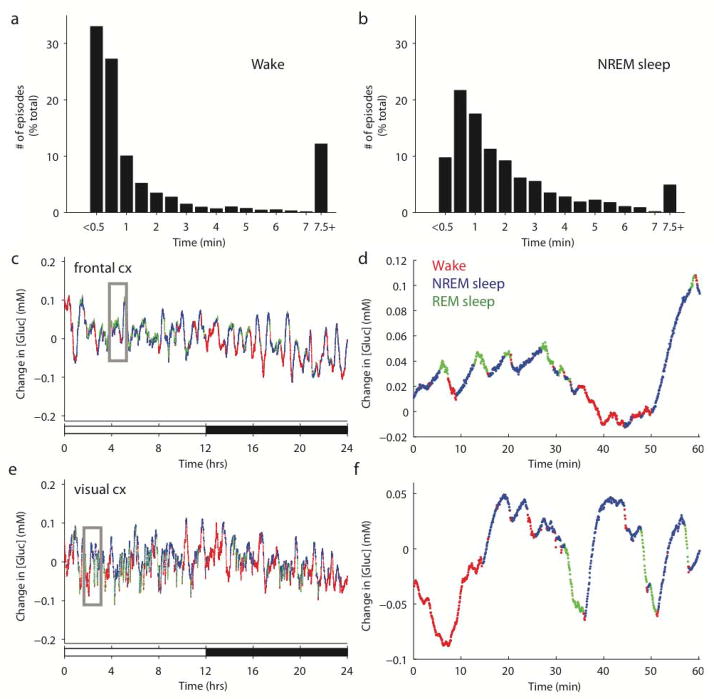
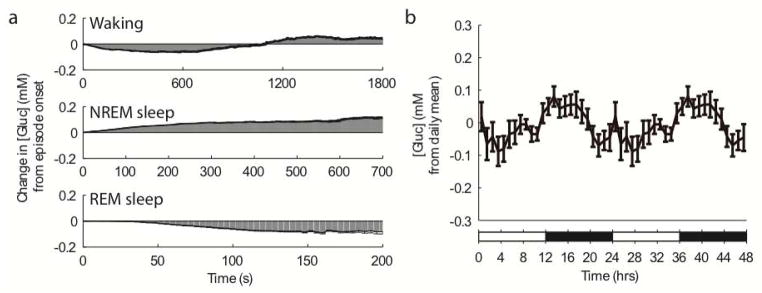
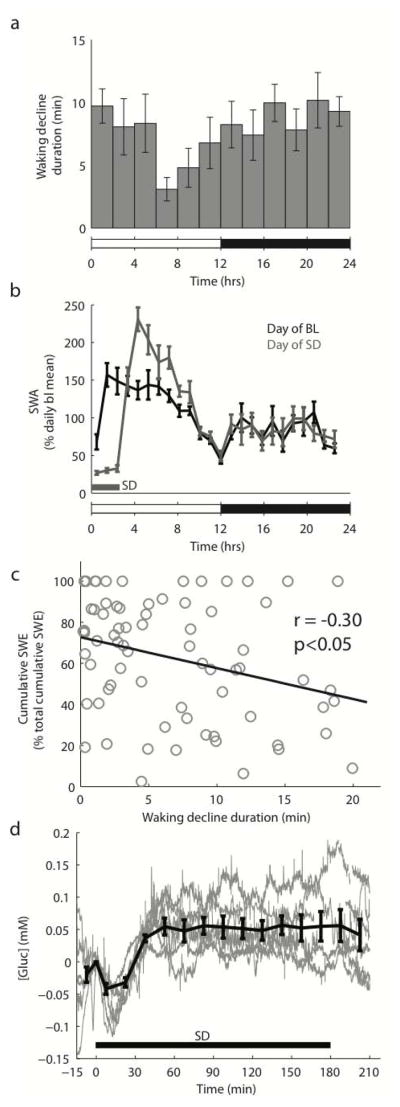
Most of the energy in the brain comes from glucose and supports glutamatergic activity. The firing rate of cortical glutamatergic neurons, as well as cortical extracellular glutamate levels, increase with time spent awake and decline throughout non rapid eye movement sleep, raising the question whether glucose levels reflect behavioral state and sleep/wake history. Here chronic (2-3 days) electroencephalographic recordings in the rat cerebral cortex were coupled with fixed-potential amperometry to monitor the extracellular concentration of glucose ([gluc]) on a second-by-second basis across the spontaneous sleep-wake cycle and in response to 3 h of sleep deprivation. [Gluc] progressively increased during non rapid eye movement sleep and declined during rapid eye movement sleep, while during wake an early decline in [gluc] was followed by an increase 8-15 min after awakening. There was a significant time of day effect during the dark phase, when rats are mostly awake, with [gluc] being significantly lower during the last 3-4 h of the night relative to the first 3-4 h. Moreover, the duration of the early phase of [gluc] decline during wake was longer after prolonged wake than after consolidated sleep. Thus, the sleep/wake history may affect the levels of glucose available to the brain upon awakening.


Conflict of interest statement

All authors have indicated no conflicts of interest.

Figures

Figure 1
Figure 1. In vitro and in vivo assessment of glucose-sensitive microelectrodes
a) Schematic of experimental design. White and black bars indicate the light and dark phase, respectively. b) A typical in vitro calibration conducted following removal of electrode from a chronic in vivo recording. Arrows depict 1mM additions of glucose to the calibration solution. After 3 days of in vivo recordings, this electrode still responds robustly (8.27 nA/mM) and linearly to glucose, as particularly evident in the inset. c) [Gluc] in frontal cortex largely increases following an i.p. injection of glucose (black; 2mL of 30% glucose) but is largely unaffected by an equivalent volume injection of saline (grey). d) [Gluc] in frontal cortex increases during ketamine/xylazine anesthesia (87 mg/kg and 13 mg/kg). Following recovery from anesthesia, [gluc] remains elevated for ~5 hours.
Figure 2
Figure 2. Changes in [gluc] associated with behavioral state
Characterization of all episodes of wake (a) and NREM sleep (b) from all rats as a function of their duration. The final bin (7.5+) includes all episodes with durations greater than 7.5 minutes. [Gluc] in frontal (c-d) or visual (e-f) cortex is depicted for each 4-sec epoch of wake (red), NREM sleep (blue), or REM sleep (green) across 24 hours. Panels d and f show at higher resolution the boxed regions indicated in c and e, respectively. For all graphs, [gluc] is depicted as a change in concentration relative to the 24-hr mean. White and black bars indicate the light and dark phase, respectively.
Figure 3
Figure 3. Effects of duration of sleep/wake episodes on [gluc]
a) State-dependent changes in [gluc] are depicted for wake, NREM, and REM sleep. Each panel depicts the average change in [gluc] across all episodes of a particular behavioral state. Unidirectional error bars (black) depict½ the standard error. b) Changes in [gluc] across the light/dark cycle. Data are double plotted, revealing that [gluc] typically increases across the light period and decreases across the dark period. Values are mean ± SEM.
Figure 4
Figure 4. Effects of sleep/wake history on [gluc]
a) 24-hr profile of the duration of the early decline phase during wake (2-hr bins). b) Average (n=6 rats) 24-hr profile (1-hr bins) of NREM SWA during undisturbed baseline days (BL) and on days that began with a 3-hr sleep deprivation (SD). c) Negative correlation between the duration of the decline phase during wake and SWE across the light phase during baseline. Each point depicts the average wake decline duration and SWE across 2-hr bins of the light period. d) Changes in [gluc] during a 3-hr sleep deprivation beginning at light onset. Grey lines refer to individual rats (n = 6), while the black line is the group average. Values are mean ± SEM.

References

    1. Alfoldi P, Franken P, Tobler I, Borbely AA. Short light-dark cycles influence sleep stages and EEG power spectra in the rat. Behavioral Brain Research. 1991;43:125–131. - PubMed
    1. Attwell D, Laughlin SB. An energy budget for signaling in the grey matter of the brain. J Cereb Blood Flow Metab. 2001;21:1133–1145. - PubMed
    1. Bazzu G, Puggioni GG, Dedola S, et al. Real-time monitoring of brain tissue oxygen using a miniaturized biotelemetric device implanted in freely moving rats. Anal Chem. 2009;81:2235–2241. - PubMed
    1. Benoit-Marand M, Suaud-Chagny MF, Gonon F. Presynaptic Regulation of Extracellular Dopamine as Studied by Continuous Amperometry in Anesthetized Animals. In: Michael A, Borland L, editors. Electrochemical Methods for Neuroscience. CRC Press; Boca Raton: 2007. - PubMed
    1. Bittner CX, Valdebenito R, Ruminot I, et al. Fast and reversible stimulation of astrocytic glycolysis by K+ and a delayed and persistent effect of glutamate. J Neurosci. 2011;31:4709–4713. - PMC - PubMed

Publication types