. 2013 Sep 26;32(39):4634-45.
doi: 10.1038/onc.2012.491. Epub 2012 Oct 29.

The Forkhead Box M1 protein regulates BRIP1 expression and DNA damage repair in epirubicin treatment

Affiliations

The Forkhead Box M1 protein regulates BRIP1 expression and DNA damage repair in epirubicin treatment

L J Monteiro et al. Oncogene. .

Abstract

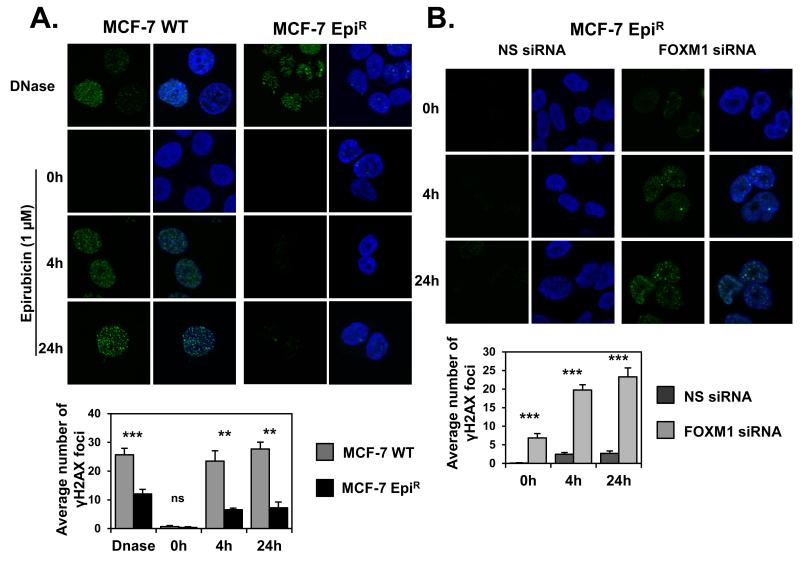
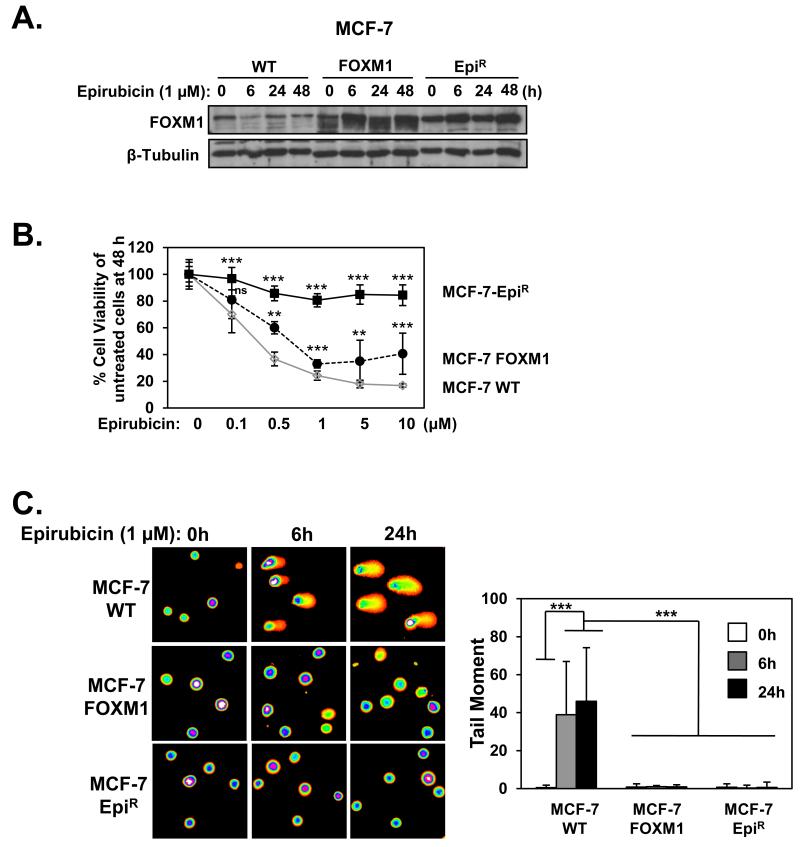
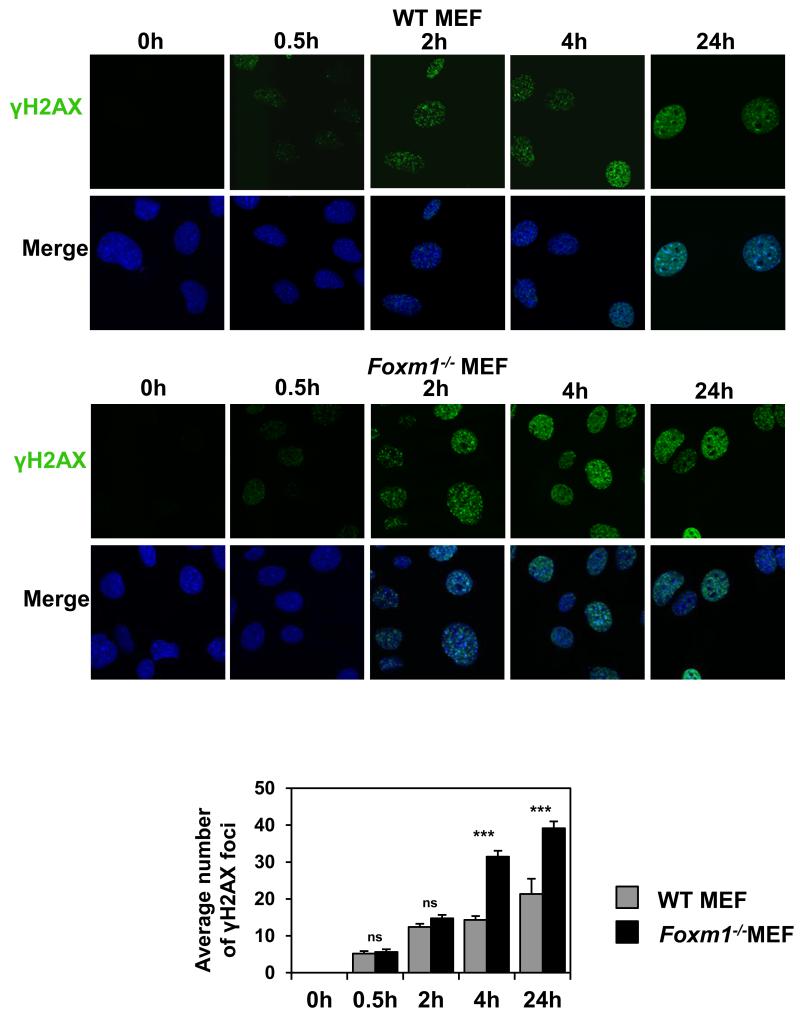
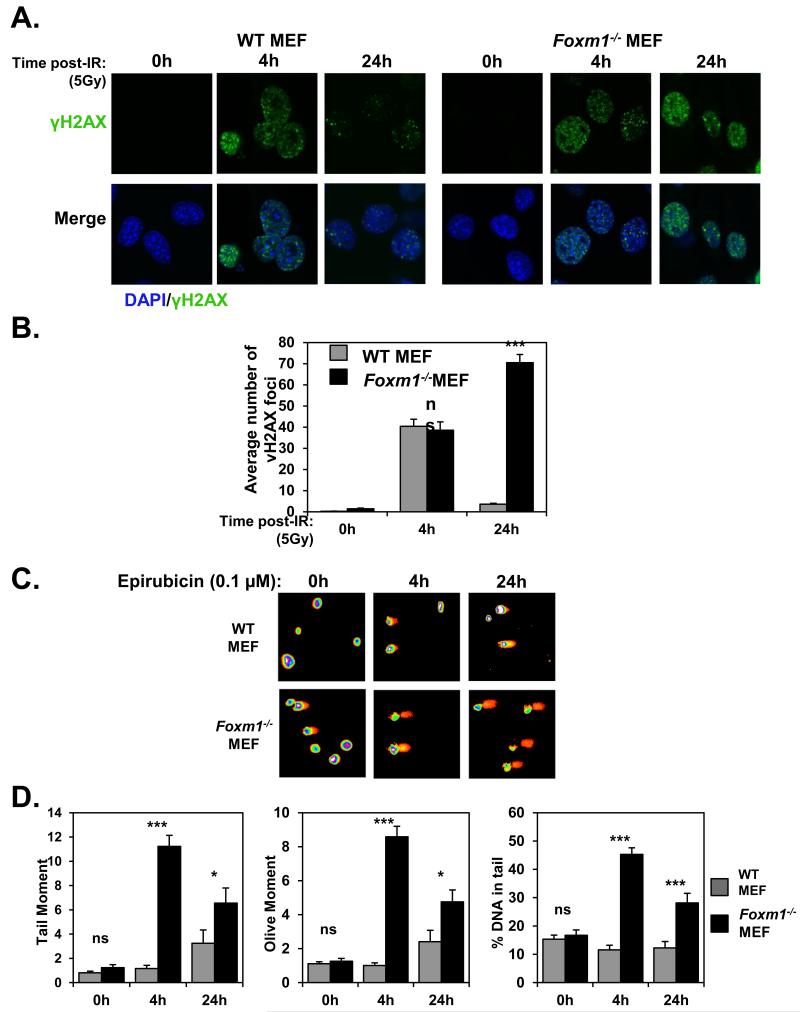
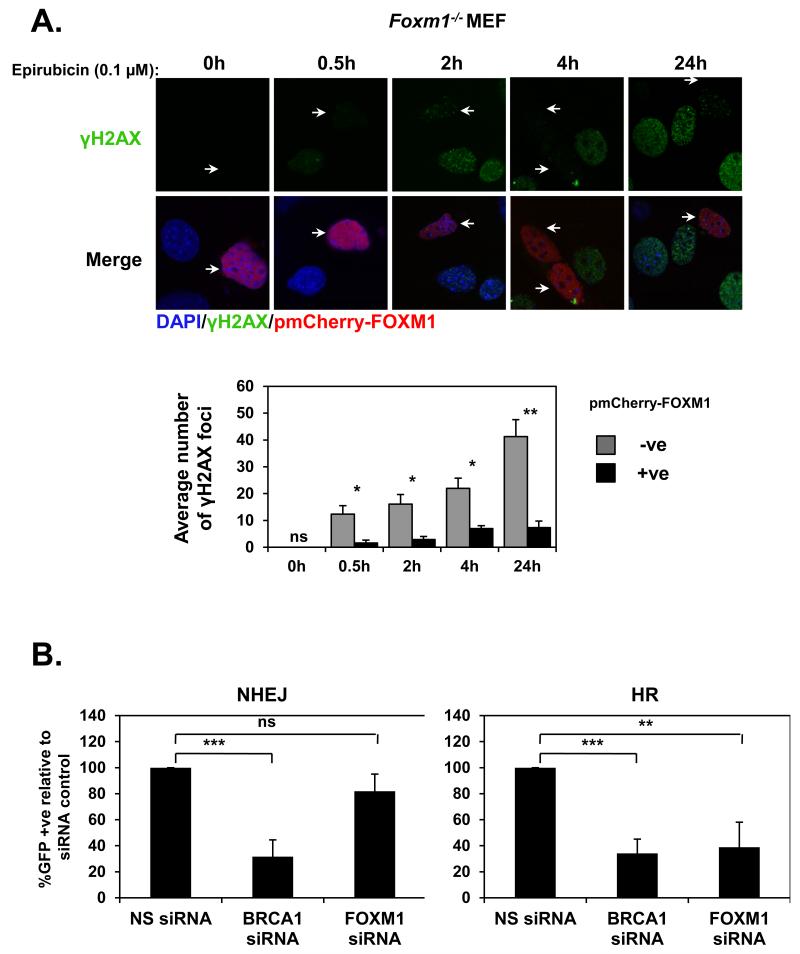
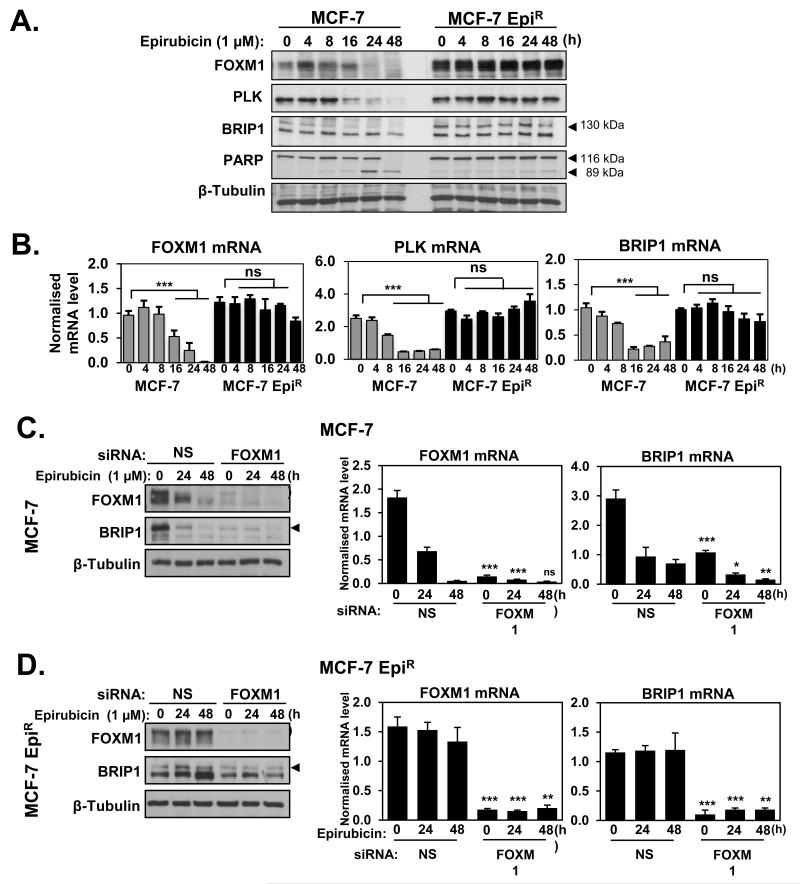
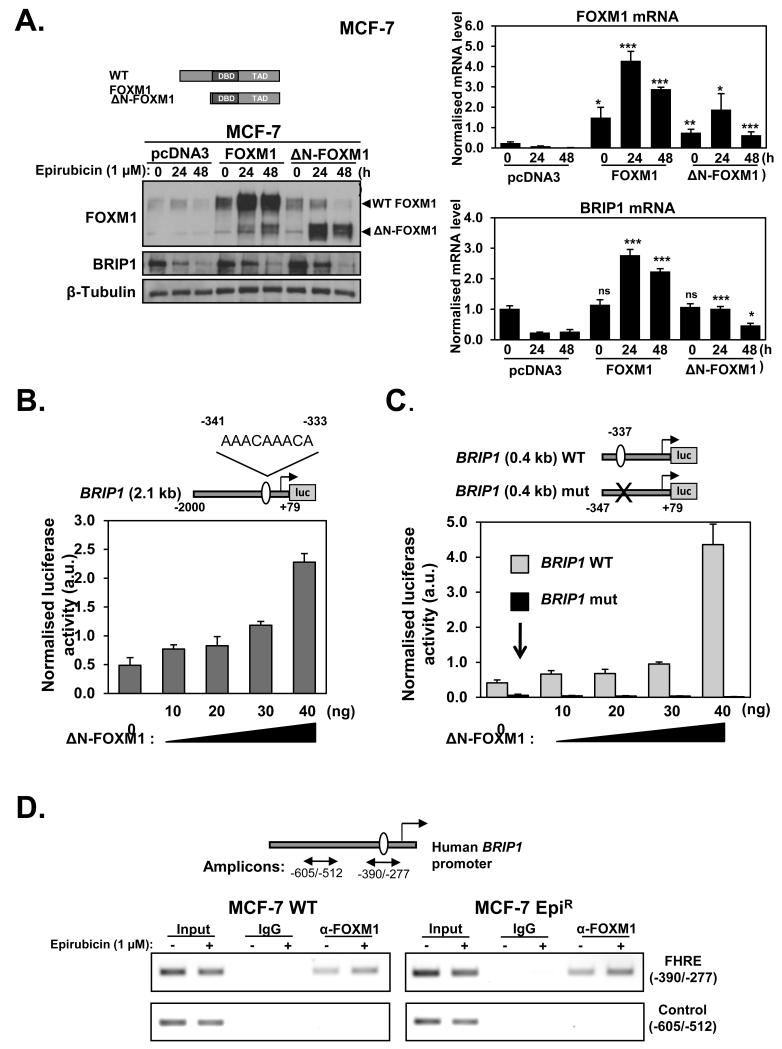
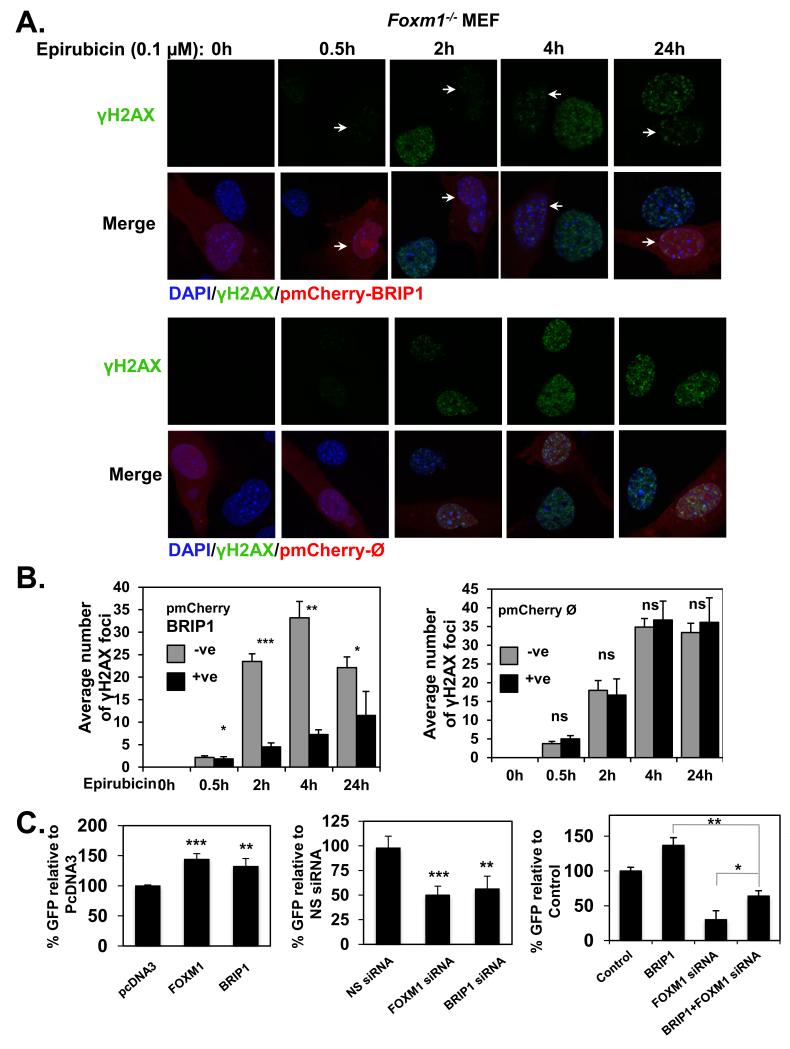
FOXM1 is implicated in genotoxic drug resistance but its role and mechanism of action remain unclear. Here, we establish that γH2AX foci, indicative of DNA double-strand breaks (DSBs), accumulate in a time-dependent manner in the drug-sensitive MCF-7 cells but not in the resistant counterparts in response to epirubicin. We find that FOXM1 expression is associated with epirubicin sensitivity and DSB repair. Ectopic expression of FOXM1 can increase cell viability and abrogate DSBs sustained by MCF-7 cells following epirubicin, owing to an enhancement in repair efficiency. Conversely, alkaline comet and γH2AX foci formation assays show that Foxm1-null cells are hypersensitive to DNA damage, epirubicin and γ-irradiation. Furthermore, we find that FOXM1 is required for DNA repair by homologous recombination (HR) but not non-homologous end joining (NHEJ), using HeLa cell lines harbouring an integrated direct repeat green fluorescent protein reporter for DSB repair. We also identify BRIP1 as a direct transcription target of FOXM1 by promoter analysis and chromatin-immunoprecipitation assay. In agreement, depletion of FOXM1 expression by small interfering RNA downregulates BRIP1 expression at the protein and mRNA levels in MCF-7 and the epirubicin-resistant MCF-7 Epi(R) cells. Remarkably, the requirement for FOXM1 for DSB repair can be circumvented by reintroduction of BRIP1, suggesting that BRIP1 is an important target of FOXM1 in DSB repair. Indeed, like FOXM1, BRIP1 is needed for HR. These data suggest that FOXM1 regulates BRIP1 expression to modulate epirubicin-induced DNA damage repair and drug resistance.


Figures

Figure 1
Figure 1. FOXM1 depletion leads to increased levels of DNA damage
A. MCF-7 WT and MCF-7 EpiR cells were cultured on coverslips and treated with 1 μg/mL DNAse I for 60 min or with 1 μM of epirubicin for 0, 4 and 24 h, as indicated, and stained for γH2AX and 4′,6-diamidino-2-phenylindole (DAPI). Images were acquired with Leica TCS SP5 microscope. B. MCF-7 EpiR cells were transfected with control siRNA (NS siRNA) or with FOXM1 siRNA for 48 h. Cells were cultured on coverslips and treated with 1 μM of epirubicin for 0, 4 and 24 hours and stained for γH2AX and DAPI. Images were acquired with Leica TCS SP5. The panels below A. and B. show quantification of γH2AX foci number. Bars represent average of three independent experiments ± SEM. Statistical analyses were conducted using Student’s t tests against the correspondent time point. **, p ≤ 0.001; ***, p ≤ 0.0001, significant; ns, non-significant.
Figure 2
Figure 2. Overexpression of FOXM1 confers epirubicin resistance and impairs DNA damage
A. The MCF-7 WT, MCF-7-FOXM1 and MCF-7 EpiR cell lines were treated with 1 μM of epirubicin at indicated times and analysed for FOXM1 and β-Tubulin. B. MCF-7 WT, FOXM1 and EpiR cells were treated with increasing concentrations of epirubicin for 48 h and their cell viability measured by SRB assay. Representative data from 3 independent experiments are shown. Statistical analyses were performed using Student’s t tests and compared to the MCF-7 WT for the correspondent epirubicin concentration. *, p ≤ 0.05; ***, p ≤ 0.0001. C. MCF-7 WT, FOXM1 and EpiR cells were exposed to 1 μM of epirubicin for 0, 6 and 24 h and assayed for comet assay. The DNA damage was quantified using the tail moment (right panel). Represented data is average of two independent experiments (100 comets were measured per experiment). Error bars denote standard deviation. Statistical significance was performed using Student’s t tests (***, p ≤ 0.0001, significant). Results were tested for significance against the correspondent time point in the MCF-7 WT cell line.
Figure 3
Figure 3. Foxm1−/− MEFs cells accumulate higher levels of γH2AX foci than WT MEFs in response to epirubicin treatment
WT and Foxm1−/− MEFs cultured in chamber culture slides were treated with 0.1 μM of epirubicin for 0, 0.5, 2, 4 and 24 h and stained for γH2AX (green). Nuclei were counterstained with DAPI (blue). Images were acquired with Leica TCS SP5. γH2AX foci quantification is shown in the lower panel. Bars represent average of three independent experiments ± SEM. Statistical analyses were conducted using Student’s t tests. ***, p ≤ 0.0001, significant; ns, non-significant.
Figure 4
Figure 4. Foxm1−/− MEFs accumulate sustained higher levels of DNA damage in reponse to γ-irradiation and epirubicin treatment
WT and Foxm1−/− MEF seeded on culture chamber slides were either non-radiated (control; 0h) or exposed to 5 Gy of γ-irradiation for 4 and 24 h. Cells were then fixed and immunostained for anti-γH2AX with Alexa Fluor 488 anti-rabbit sera (green). Nuclei were counterstained with DAPI (blue). Images were acquired with Leica TCS SP5 (63× magnification). B. For each time point, images of at least 100 cells were captured and used for quantification of γH2AX foci number. The average number of foci per each image was quantified using the CellProfiler software. Results represent average of 3 independent experiments ± SEM. Statistical analyses were conducted using Student’s t tests against the correspondent time point. ***, p ≤ 0.0001 significant; ns, non-significant. C. WT and Foxm1−/− MEFs were exposed to 0.1 μM of epirubicin for 0, 4 and 24 h and subjected to comet assay. Representative images of three independent assays are shown. The DNA migration pattern with the comet head represents intact DNA and the comet tail broken DNA strands that migrate towards the anode. D. DNA damage was measured with Comet Assay IV and analysed for the following parameters: Tail moment (left panel), Olive moment (middle panel), % of DNA in tail (right panel). The represented data is average of two independent experiments (100 comets were measured per experiment). Bars represent average ± SEM. Statistical analyses were conducted using Student’s t tests against the correspondent time point. **, p ≤ 0.001; ***, p ≤ 0.0001, significant; ns, non-significant.
Figure 5
Figure 5. FOXM1 decreases γH2AX foci accumulation in Foxm1−/− MEFs and is involved in homologous recombination repair
A. Foxm1−/− MEFs transfected with the pmCherry-FOXM1 (red) and treated with 0.1 μM of epirubicin for 0, 0.5, 2, 4 and 24 h were stained for γH2AX followed by addition of Alexa488 (green)-labelled anti-rabbit. Nuclei were counterstained with DAPI (blue). Images were acquired with Leica TCS SP5. γH2AX foci quantification is shown in the lower panel. Bars represent average of three independent experiments ± SEM. Statistical analyses were conducted using Student’s t tests. *, p ≤ 0.05; **; p ≤ 0.001, significant; ns, non-significant. −ve, negative pmCherry-FOXM1 cells; +ve, positive pmCherry-FOXM1 cells. B. Non-homologous end joining (NHEJ) and homologous recombination (HR) were assayed in HeLa cells using DR-GFP reporter system bearing integrated end-joining and gene conversion substrates. Cells were transfected with nonspecific (NS) siRNA, si smart pool against BRCA1 or si smart pool against FOXM1. Forty-eight hours after transfection, cells were transfected again with I-SceI and left for 72 h before analysis. GFP-positive cells are indicated for each siRNA, with standard deviation based on three independent experiments (a total of 50,000 events were analysed for each experiment, and experiments were performed in duplicate). Statistical analyses were conducted using Student’s t tests against the NS siRNA **, p ≤ 0.001; ***, p ≤ 0.0001, significant; ns, non-significant.
Figure 6
Figure 6. FOXM1 is upregulated in epirubicin resistant cell line (MCF-7 EpiR) and modulates the expression of BRIP1 at protein and mRNA levels
A. MCF-7 and MCF-7 EpiR cells were treated with 1 μM of epirubicin for 0, 4, 8, 16, 24 and 48 h. Cells were collected at indicated times and analysed by western blot to determine the protein expression levels of FOXM1, PLK, BRIP1, PARP and β-Tubulin (arrows indicate the specific protein band) B. and by qRT-PCR to determine FOXM1, PLK and BRIP1 mRNA transcript levels normalised to L19 mRNA expression. Columns are the mean of three independent experiments in triplicate; bars, ± SD. Statistical analyses were performed using Student’s t tests against the 0 h time point. ***, p ≤ 0.0001, significant; ns, non-significant. C. MCF-7 and D. MCF-7 EpiR cells were transfected with nonspecific (NS) siRNA or siRNA smart pool against FOXM1. Twenty-four hours after transfection, cells were treated with 1 μM of epirubicin and harvested for western blot (left panel) and qRT-PCR (right panel) analyses at 0, 24 and 48 h. Protein expression levels were determined for FOXM1, BRIP1 and β-Tubulin and mRNA levels for FOXM1 and BRIP1. Statistical analyses were performed using Student’s t tests and compared to the correspondent time point in the control NS siRNA transfected cells. Columns are the mean of three independent experiments in triplicate; bars, ± SD. *, p ≤ 0.05; **, p ≤ 0.001; ***, p ≤ 0.0001, significant; ns, non-significant.
Figure 7
Figure 7. FOXM1 regulates BRIP1 expression through a forkhead responsive element (FHRE) consensus on its promoter
A. MCF-7 cells were transiently transfected with 3 μg of pcDNA3, (control) pcDNA3-FOXM1 or pcDNA3-ΔN-FOXM1 and 24 h after transfection treated with 1 μM of epirubicin for 0, 24 and 48 h. The protein expression levels were determined by western blot using specific antibodies as indicated (left panel). Gene transcripts of these cells were analysed by qRT-PCR (right panels) for FOXM1 and BRIP1 normalised to L19 mRNA expression. Columns are the mean of three independent experiments in triplicate; bars, ± SD. Statistical significance was determined using Student’s t tests and compared to the correspondent time point in the control pcDNA3 transfected cells. *, p ≤ 0.05; **, p ≤ 0.001; ***, p ≤ 0.0001, significant; ns, non-significant. B. MCF-7 cells were transiently transfected with 20 ng of the pGL3-BRIP1 promoter, C. pGL3-BRIP1 (0.4kb) WT or pGL3-BRIP1 (0.4kb) mut together with increasing amounts (0, 10, 20, 30 and 40 ng) of ΔN -FOXM1 expression vector. Cells were harvested after 24 h of transfection and assayed for luciferase activity. All relative luciferase activity values are corrected for cotransfected Renilla activity. Each column represents the mean ± SD from 3 independent experiments. D. MCF-7 and MCF-7 EpiR cells untreated or treated with 1 μM of epirubicin for 16 h were used for ChIP assays by using IgG negative control and anti-FOXM1 antibody, as indicated. After reversal of cross-linking, the coimmunoprecipitated DNA was amplified by PCR, using primers amplifying the FOXM1 FHRE-binding site containing region (−390/−277) and a control region (−605/−512), and resolved in 2% agarose gel. Inverted ethidium bromide stained images are shown.
Figure 8
Figure 8. BRIP1 decreases γH2AX foci accumulation in Foxm1−/− MEFs and is involved in homologous recombination repair with FOXM1
Foxm1−/− MEFs transfected with the pmCherry-BRIP1 or pmCherry-ᴓ (red) and treated with 0.1 μM of epirubicin for 0, 0.5, 2, 4 and 24 h were stained for γH2AX followed by addition of Alexa488 (green)-labelled anti-rabbit. Nuclei were counterstained with DAPI (blue). Images were acquired with Leica TCS SP5. B. γH2AX foci quantification is shown. Bars represent average of three independent experiments ± SEM. *, p ≤ 0.05; **, p ≤ 0.001; ***, p ≤ 0.0001, significant; ns, non-significant. −ve, negative pmCherry cells; +ve, positive pmCherry cells. C. Homologous recombination (HR) was assayed in HeLa cells using DR-GFP reporter system bearing an integrated gene conversion substrate. Cells were either transfected with control pcDNA3, pcDNA3-FOXM1 or pcDNA3-myc-his-BRIP1 (left panel) or with nonspecific (NS) siRNA, FOXM1 siRNA or BRIP1 siRNA (middle panel), or control, pcDNA3-myc-his-BRIP1, FOXM1 siRNA, or pcDNA3-myc-his-BRIP1 plus FOXM1 siRNA (right panel). Forty-eight hours after transfection, cells were transfected again with I-SceI and left for 72h before analysis. GFP-positive cells are indicated for each transfection, with standard deviation based on three independent experiments (a total of 50,000 events were analysed for each experiment, and experiments were performed in duplicate). Bars represent average of three independent experiments ± SD. Significance was determined using Student’s t tests and compared to the controls pcDNA3 or NS siRNA transfected cells, accordingly. *, p ≤ 0.05; **, p ≤ 0.001; ***, p ≤ 0.0001, significant.

References

    1. Lin SX, Chen J, Mazumdar M, Poirier D, Wang C, Azzi A, et al. Molecular therapy of breast cancer: progress and future directions. Nat Rev Endocrinol. 2010 Sep;6(9):485–93. - PubMed
    1. Alvarez RH, Valero V, Hortobagyi GN. Emerging targeted therapies for breast cancer. J Clin Oncol. [Research Support, Non-U.S. Gov’t Review] 2010 Jul 10;28(20):3366–79. - PubMed
    1. Zelnak A. Overcoming taxane and anthracycline resistance. Breast J. 2010 May-Jun;16(3):309–12. - PubMed
    1. Stearns V, Davidson NE, Flockhart DA. Pharmacogenetics in the treatment of breast cancer. Pharmacogenomics J. [Research Support, Non-U.S. Gov’t Research Support, U.S. Gov’t, P.H.S. Review] 2004;4(3):143–53. - PubMed
    1. Minotti G, Menna P, Salvatorelli E, Cairo G, Gianni L. Anthracyclines: molecular advances and pharmacologic developments in antitumor activity and cardiotoxicity. Pharmacol Rev. [Research Support, Non-U.S. Gov’t Review] 2004 Jun;56(2):185–229. - PubMed

Publication types

MeSH terms