. 2012 Dec 15;125(Pt 24):6084-93.
doi: 10.1242/jcs.112631. Epub 2012 Oct 29.

Antibodies binding the ADAM10 substrate recognition domain inhibit Eph function

Affiliations

Antibodies binding the ADAM10 substrate recognition domain inhibit Eph function

Lakmali Atapattu et al. J Cell Sci. .

Abstract

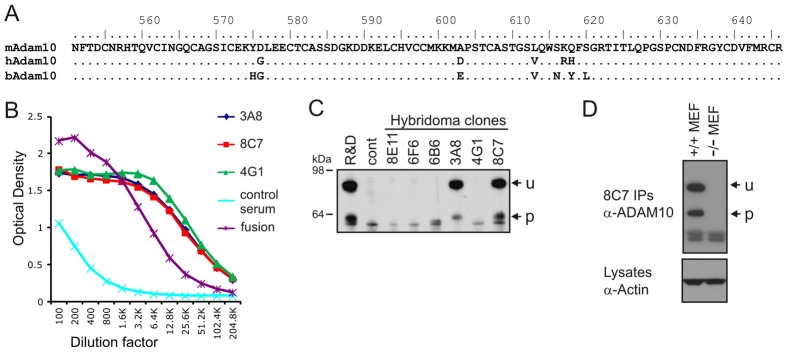
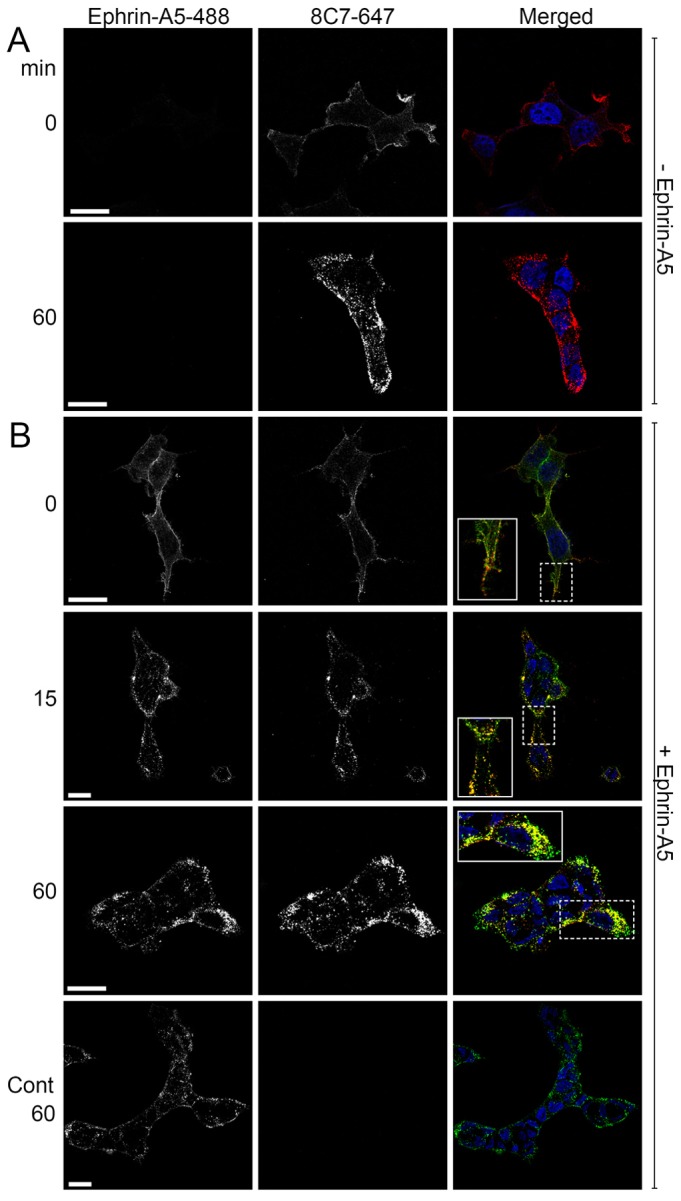
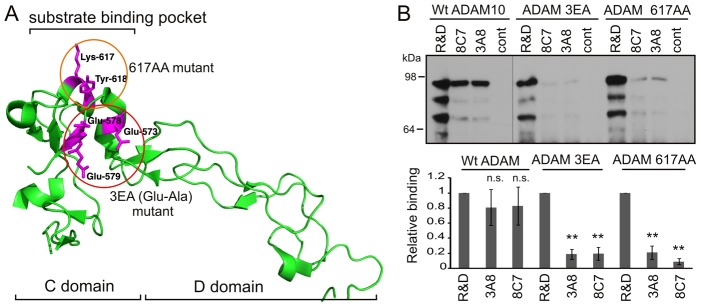
The ADAM10 transmembrane metalloprotease cleaves a variety of cell surface proteins that are important in disease, including ligands for receptor tyrosine kinases of the erbB and Eph families. ADAM10-mediated cleavage of ephrins, the ligands for Eph receptors, is suggested to control Eph/ephrin-mediated cell-cell adhesion and segregation, important during normal developmental processes, and implicated in tumour neo-angiogenesis and metastasis. We previously identified a substrate-binding pocket in the ADAM10 C domain that binds the EphA/ephrin-A complex thereby regulating ephrin cleavage. We have now generated monoclonal antibodies specifically recognising this region of ADAM10, which inhibit ephrin cleavage and Eph/ephrin-mediated cell function, including ephrin-induced Eph receptor internalisation, phosphorylation and Eph-mediated cell segregation. Our studies confirm the important role of ADAM10 in cell-cell interactions mediated by both A- and B-type Eph receptors, and suggest antibodies against the ADAM10 substrate-recognition pocket as promising therapeutic agents, acting by inhibiting cleavage of ephrins and potentially other ADAM10 substrates.


Figures

Fig. 1.
Fig. 1.
Specificity of α-ADAM10 monoclonal antibodies. (A) Alignment of mouse, human and bovine ADAM10 cysteine-rich domain sequences (AA 551–646). In the human and bovine sequences, only residues not homologous to mouse are shown. (B) Comparison of binding of mouse hybridoma (fusion) and isolated cell clone supernatants to serially diluted, immobilised bovADAM10 ECD by ELISA. Binding of non-immunised mouse serum (control) is shown for comparison. (C) Binding of endogenous huADAM10 by α-ADAM10 hybridoma clones, or the R&D ADAM10 mAb 1427, was compared by immunoprecipitation from equivalent HEK293 cell lysates and western blotting with an α-ADAM10 pAb; u, unprocessed; p, processed ADAM10. (D) The specificity of 8C7 for ADAM10 was tested by immunoprecipitation from lysates of ADAM10 knockout (−/−) and Wt (+/+) mouse embryonic fibroblasts (MEFs), and α-ADAM10 pAb western blot.
Fig. 2.
Fig. 2.
Co-staining of cells with ADAM10 mAb 8C7 and ephrin-A5-Fc reveals colocalisation and co-internalisation with EphA3. (A) EphA3/HEK293 cells were incubated on ice with Alexa647–8C7 mAb and fixed for imaging (0 min) or first allowed to warm to 37°C for 60 min. (B) Cells were labelled with Alexa647–8C7 and with Alexa488–ephrin-A5-Fc and fixed immediately (0 min) or incubated at 37°C with α-humanFc to cluster ephrin-A5-Fc for the indicated time periods before fixation. The insets are enlarged images of the regions within the dotted lines. Cells incubated for 60 min with Alexa488–ephrin-A5-Fc alone are shown as a control in the bottom panels. Scale bars: 25 µm.
Fig. 3.
Fig. 3.
Site-directed mutagenesis of the ADAM10 substrate-binding pocket disrupts mAb binding. (A) Structure of the bovine ADAM10 D and C domains showing the location of key residues targeted by site-directed mutagenesis. (B) Comparison of αADAM10 mAb binding to Wt and substrate-binding pocket mutant huADAM10. Alanine substitutions at Glu 573, 578 and 579 (3EA) or at residues 617 and 618 (617AA) were made in huADAM10-GFP, and Wt and mutant constructs were transfected into ADAM10−/− MEFs (control: untransfected). Binding of α-ADAM10 mAbs was assessed by immunoprecipitation from equivalent cell lysates, and western blotting with α-ADAM10 pAb (non-relevant lanes removed; the altered molecular mass pattern reflects the GFP-tagged huADAM10). The graph shows binding of 8C7 and 3A8 relative to the R&D mAb, determined by densitometry (one-way ANOVA; **P<0.01 compared to R&D sample; n.s., not significant; n = 3).
Fig. 4.
Fig. 4.
8C7 α-ADAM mAb blocks ephrin shedding and internalisation. (A) Ephrin internalisation from Alexa594–ephrin-A5-coated tissue culture surfaces. EphA3/293 cells were pre-incubated with 0, 100 or 400 µg/ml 8C7 for 1 h before plating onto Alexa594–ephrin-A5-Fc-coated tissue culture surfaces. Cells were detached and plated onto fibronectin-coated glass coverslips for fluorescence microscopy. Representative images from two independent experiments are shown, and internalised ephrin fluorescence/cell quantified from a minimum of 10 fields of view, using ImageJ software. (B) Cells treated with non-clustered or pre-clustered (X-lk) 8C7 at the indicated concentrations were plated onto Alexa594–ephrin-A5-Fc as in A and detached cells were analysed by flow cytometry. Histograms of the different cell populations show the mean and s.e.m. (normalised to the non-treated sample with a value of 1) from three independent experiments. (C) Ephrin internalisation of GFP–ephrin-A5 cells. GFP–ephrin-A5/293 cells and Cell-Tracker-red-labelled EphA3/293 cells were pre-incubated with 0, 100, 200 or 400 µg/ml 8C7 mAb, or with metalloprotease inhibitors GM6001 (GM; 50 µM) or TAPI1 (50 µM), then co-cultured for 1 h before fixation and nuclear staining with Hoechst (blue). Images were taken by confocal microscopy; examples are shown from control and treated cultures (8C7, 400 µg/ml). Arrows: internalised GFP–ephrin in red-labelled EphA3 cells, bar (formula image
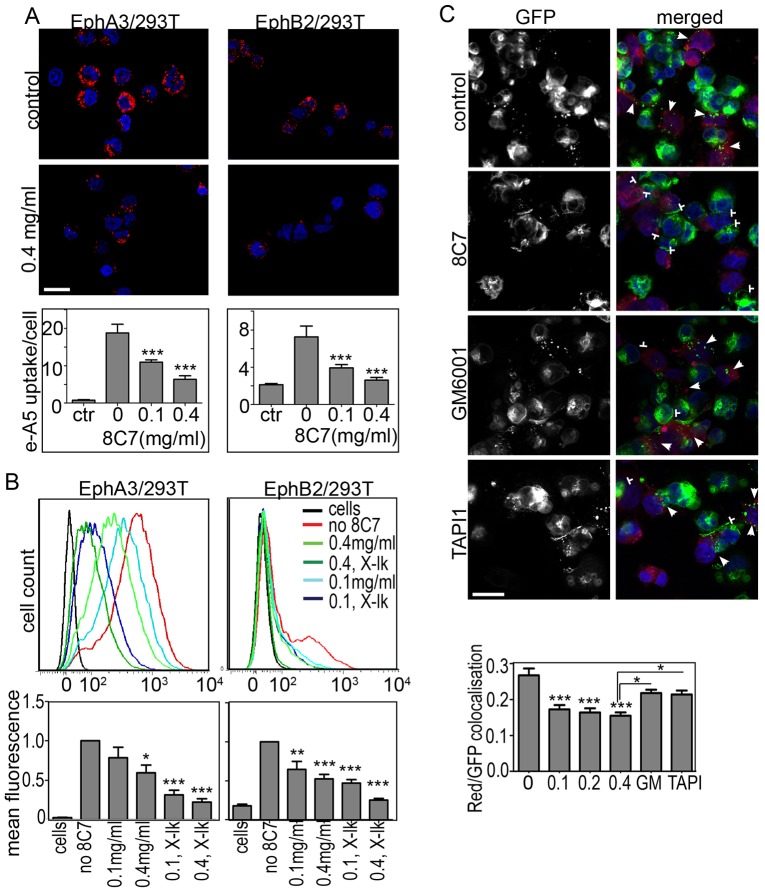
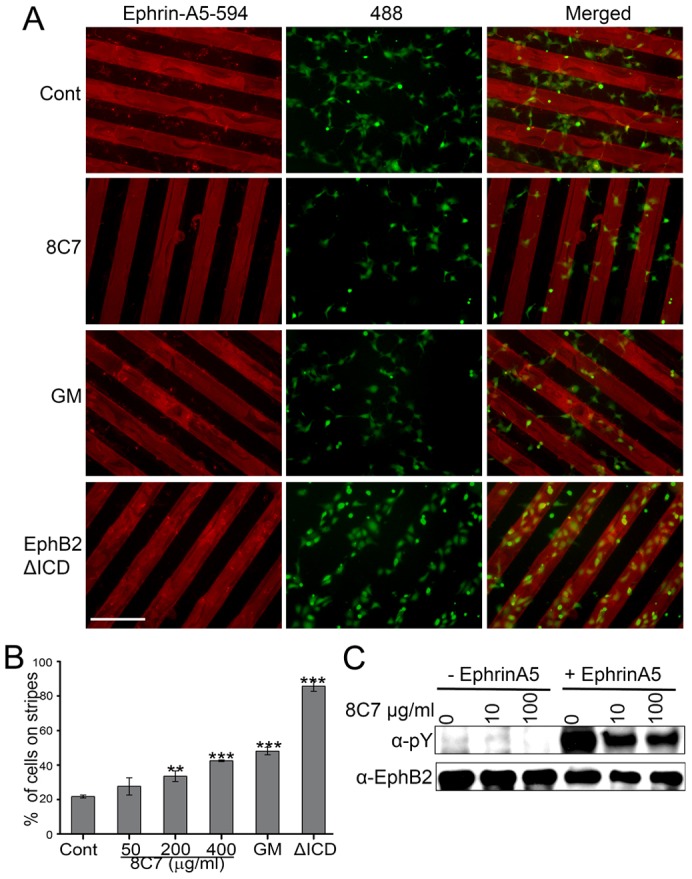
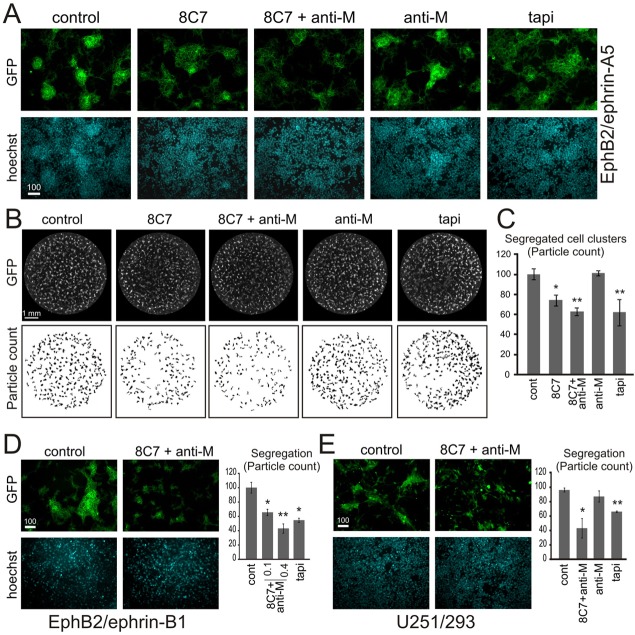
) indicates blockade of ephrin cleavage at cell-cell junctions. Ephrin internalisation was calculated using colocalisation of green (ephrin) with red (Eph/293); values are means ± s.e.m., n = 5. *P<0.05, ***P<0.001: significant difference from the untreated or indicated sample. Scale bars: 20 µm.
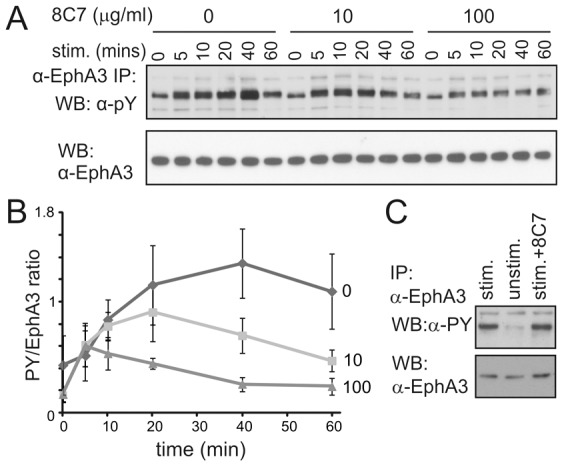
Fig. 5.
Fig. 5.
ADAM10 mAb 8C7 inhibits EphA3 phosphorylation in response to stimulation by cell-bound ephrin. (A) 293/EphA3 cells were pretreated with 0, 10 and 100 µg/ml of 8C7 mAb for 2 h and stimulated for the indicated times. α-EphA3 immunoprecipitates from the cell lysates were analysed by western blot with α-phosphotyrosine (pY) and α-EphA3 antibodies as indicated. A representative image from four experiments is shown. (B) EphA3 phosphorylation relative to EphA3 protein levels was calculated from replicate experiments as described in A, using densitometry analysis. Graph shows means ± s.e.m., n = 4. (C) 8C7 does not inhibit EphA3 phosphorylation induced by soluble clustered ephrin-A5. EphA3/293 cells, pre-incubated with or without 8C7 (100 µg/ml) for 2 hours, were stimulated for 20 min with pre-clustered ephrin-A5-Fc, or left unstimulated, as indicated. EphA3 immunoprecipitates from cell lysates were analysed by western blotting as in A.
Fig. 6.
Fig. 6.
ADAM10 mAb 8C7 blocks Eph/ephrin-mediated cell repulsion. (A) EphB2/HEK293 cells labelled with Cell Tracker Green were pre-treated with vehicle (Cont), 8C7 (50, 200 or 400 µg/ml), or with GM6001 (GM, 50 µM), and plated onto coverslips pre-coated with fibronectin and stripes of alexa594-labelled ephrin-A5-Fc. As a comparison, cells expressing a signalling-deficient EphB2 mutant (ΔICD) were also used. After 18 hours the cells were imaged by fluorescence microscopy, from which examples are shown (8C7, 400 µg/ml). Scale bar: 250 µm. (B) The percentage of cells adhering to ephrin stripes was calculated from ∼20 images for each treatment; the graph shows the averages ± s.e.m. from three experiments. (C) 8C7 inhibits ephrin-A5-induced EphB2 phosphorylation. Effects of 8C7 treatment on activation of EphB2/HEK293 cells by ephrin-A5/HEK293 cells was assessed as in Fig. 5A, following stimulating for 40 minutes.
Fig. 7.
Fig. 7.
8C7 blocks Eph/ephrin-mediated cell segregation. (A–C) HEK293 cells expressing EphB2 and membrane-targeted GFP were co-cultured with ephrin-A5/HEK293 cells in the presence of 0.4 mg/ml 8C7, with or without crosslinking with anti-mouse IgG. Wells treated with anti-mouse IgG alone or with TAPI1 served as negative and positive controls, respectively. Confluent cultures were analysed by fluorescence microscopy for GFP, and Hoechst staining of nuclei to show the total cell population, and representative images are shown in A. Segregated cell clusters were counted in whole well images by counting areas of thresholded intensity above a set size equating to roughly 40–50 cells (Solanas et al., 2011) (B), and mean numbers (n = 4) were calculated with standard errors (C). (D) Segregation assay performed with EphB2–GFP- and ephrin-B1-expressing HEK293 cells showing key representative examples and quantification. (E) Segregation assay performed with Cell-Tracker-Green-labelled EphA3/B2-expressing U251 glioma cells and HEK293 cells. *P<0.05, **P<0.01 relative to control (cont).

Similar articles

Cited by

References

    1. Blobel C. P. (2005). ADAMs: key components in EGFR signalling and development. Nat. Rev. Mol. Cell Biol. 6, 32–43 10.1038/nrm1548 - DOI - PubMed
    1. DasGupta S., Murumkar P. R., Giridhar R., Yadav M. R. (2009). Current perspective of TACE inhibitors: a review. Bioorg. Med. Chem. 17, 444–459 10.1016/j.bmc.2008.11.067 - DOI - PubMed
    1. Dobrowolski R., De Robertis E. M. (2012). Endocytic control of growth factor signalling: multivesicular bodies as signalling organelles. Nat. Rev. Mol. Cell Biol. 13, 53–60 10.1038/nrm3244 - DOI - PMC - PubMed
    1. Fischer O. M., Hart S., Gschwind A., Ullrich A. (2003). EGFR signal transactivation in cancer cells. Biochem. Soc. Trans. 31, 1203–1208 10.1042/BST0311203 - DOI - PubMed
    1. Guan H-H., Goh K-S., Davamani F., Wu P-L., Huang Y-W., Jeyakanthan J., Wu W-G., Chen C-J. (2010). Structures of two elapid snake venom metalloproteases with distinct activities highlight the disulfide patterns in the D domain of ADAMalysin family proteins. J. Struct. Biol. 169, 294–303 10.1016/j.jsb.2009.11.009 - DOI - PMC - PubMed

Publication types