. 2012 Oct;72(4):517-24.
doi: 10.1002/ana.23747.

Neuron-to-neuron transmission of α-synuclein fibrils through axonal transport

Affiliations

Neuron-to-neuron transmission of α-synuclein fibrils through axonal transport

Eric C Freundt et al. Ann Neurol. 2012 Oct.

Abstract

Objective: The lesions of Parkinson disease spread through the brain in a characteristic pattern that corresponds to axonal projections. Previous observations suggest that misfolded α-synuclein could behave as a prion, moving from neuron to neuron and causing endogenous α-synuclein to misfold. Here, we characterized and quantified the axonal transport of α-synuclein fibrils and showed that fibrils could be transferred from axons to second-order neurons following anterograde transport.

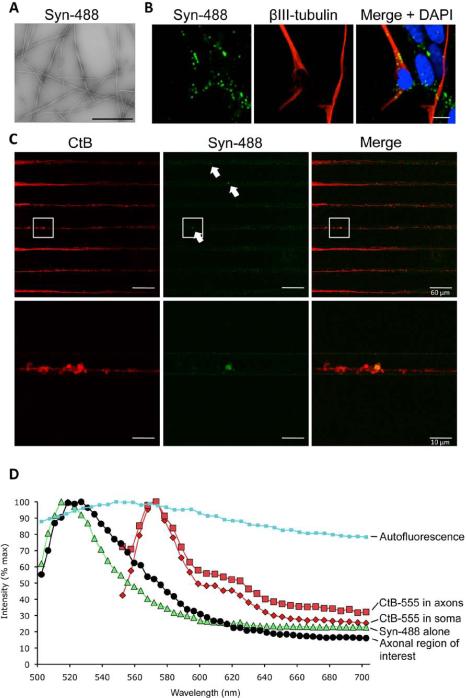
Methods: We grew primary cortical mouse neurons in microfluidic devices to separate somata from axonal projections in fluidically isolated microenvironments. We used live-cell imaging and immunofluorescence to characterize the transport of fluorescent α-synuclein fibrils and their transfer to second-order neurons.

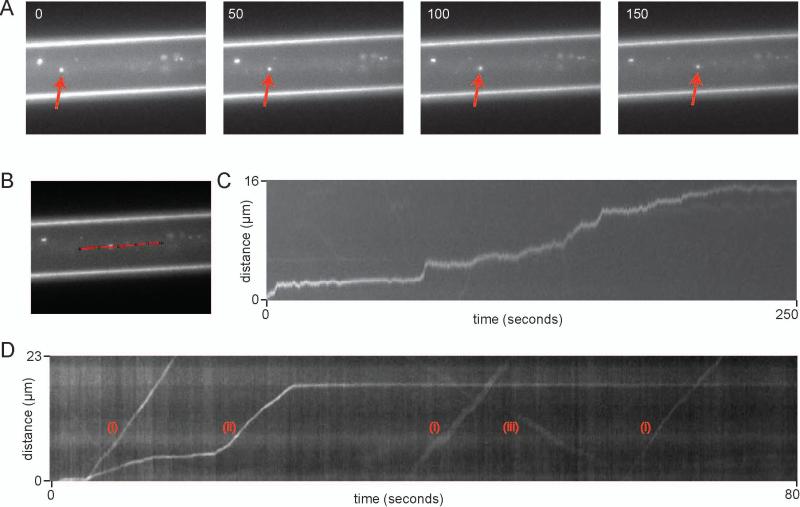
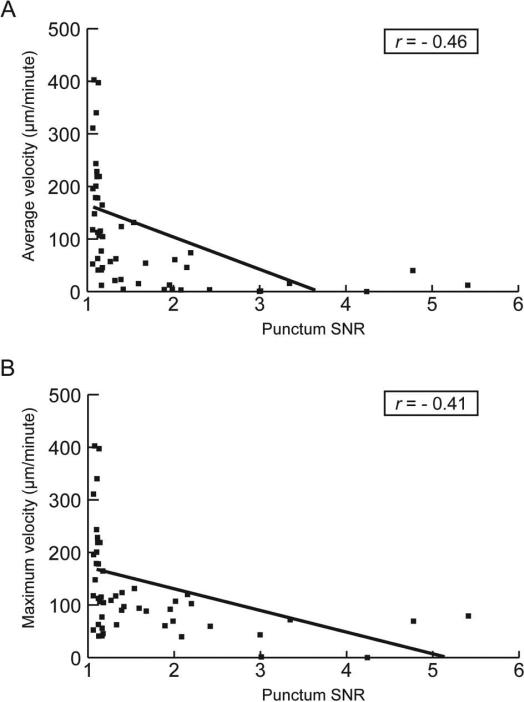
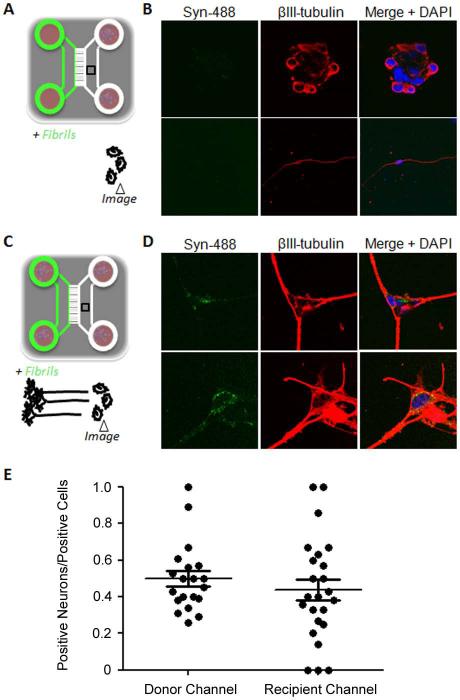
Results: Fibrillar α-synuclein was internalized by primary neurons and transported in axons with kinetics consistent with slow component-b of axonal transport (fast axonal transport with saltatory movement). Fibrillar α-synuclein was readily observed in the cell bodies of second-order neurons following anterograde axonal transport. Axon-to-soma transfer appeared not to require synaptic contacts.

Interpretation: These results support the hypothesis that the progression of Parkinson disease can be caused by neuron-to-neuron spread of α-synuclein aggregates and that the anatomical pattern of progression of lesions between axonally connected areas results from the axonal transport of such aggregates. That the transfer did not appear to be trans-synaptic gives hope that α-synuclein fibrils could be intercepted by drugs during the extracellular phase of their journey.


Figures

Figure 1
Figure 1
Internalization and anterograde axonal transport of α-synuclein by primary neurons. (A) Alexa Fluor 488-labeled α-synuclein fibrils (Syn-488) were imaged by transmission electron microscopy. Scale bar = 200nm. (B) Fibrils were added to primary cortical neurons and incubated for 24 hours. Cells were reacted with an anti-ß-III tubulin antibody to identify neurons, stained with DAPI to identify nuclei and observed by confocal microscopy. Scale bars = 10μm. (C) Anterograde axonal transport of α-synuclein fibrils. Alexa Fluor 488-labeled fibrillar α-synuclein (Syn-488) and Alexa Fluor 555-labeled cholera toxin subunit B (CtB) were added to the soma of cortical neurons in a microfluidic device. A volume difference was maintained to prevent passive diffusion of fibrillar α-synuclein into the opposite chamber. Axons within microgrooves were visualized by confocal microscopy. Areas of green fluorescence are indicated by arrows. The lower panel shows higher magnification of the boxed region. (D) Emission spectra of the regions of interest (box) shown in C. Spectra were compared with those of pure Syn-488 deposited on a microscope slide and of the red fluorescence in soma and axons (CtB-555). A typical autofluorescence signal was determined using an unrelated CNS tissue sample.
Figure 2
Figure 2
Kinetics of axonal transport of α-synuclein fibrils. (A) Representative field of time-lapse analysis for an axon in a microgroove. The two bright lines correspond to the edges of the microgroove. The red arrow indicates the movement of a punctum through an axon. The time is given in seconds in the upper left hand corner of each image. Soma is to the left. (B) Selection of axon segment for velocity and flux measurements. (C) Kymograph of the punctum from (A) as it traveled through the axonal segment highlighted in (B) over a 250s time interval. (D) A kymograph showing a variety of punctum movements, including three punctae with fast-anterograde movement (I), one punctum with a saltatory movement with a long pause (II), and one punctum that appears to move in a retrograde direction (III).
Figure 3
Figure 3
Relationship between the velocity of punctae and their size. (A) The average velocity is plotted against the signal-to-noise ratio (SNR) of the fluorescence of each punctum. (B) The maximum velocity is plotted against the SNR for each punctum. The Pearson product-moment correlation coefficient (r) and the linear association trend line are shown for both (A) and (B).
Figure 4
Figure 4
Axonal transport and transmission of α-synuclein fibrils to second order neurons. (A) Set up of the control experiment to determine background retrograde transport. Syn-488 fibrils were added to one chamber that did not contain neurons. At the same time, recipient neurons were plated in the opposite channel that was given an additional 100μl of medium to prevent diffusion. (B) After four days of incubation the cells were stained with an anti-class III ß-tubulin (ßIII-tubulin) antibody to identify neurons and imaged by confocal microscopy. The upper and lower panels show two representative fields. (C) Schematic of the experimental setup to detect and measure transfer. Neurons were plated and cultured for one week to allow them to extend their axons to the opposite channel. At that time, Syn-488 fibrils were added to the chamber containing these neuron soma and freshly isolated neurons were added to the opposite channel. After one or four days in culture, depending on the experiment, the cells in both channels were stained with an anti-ßIII-tubulin antibody and analyzed by confocal microscopy. (D) The upper and lower panels show two representative fields. (E) For the experiments schematized in C, the percentages of Syn-488-positive cells that were neurons was determined by a blinded experimenter for the first neuron channel and the recipient channel. Graphs show individual values as well as mean ± SEM.

References

    1. Lees AJ. The Parkinson chimera. Neurology. 2009;72:S2–S11.2. - PubMed
    1. Stefanis L. Alpha-synuclein in Parkinson's disease. Cold Spring Harb Perspect Med. 2012;4:a009399. - PMC - PubMed
    1. Brundin P, Li JY, Holton JL, Lindvall O, Revesz T. Research in motion: the enigma of Parkinson's disease pathology spread. Nat Reviews Neurosci. 2008;9:741–745. - PubMed
    1. Goedert M, Clavaguera F, Tolnay M. The propagation of prion-like protein inclusions in neurodegenerative diseases. Trends Neurosci. 2010;33:317–325. - PubMed
    1. Conway KA, Harper JD, Lansbury PT. Accelerated in vitro fibril formation by a mutant alpha-synuclein linked to early-onset Parkinson disease. Nat Med. 1998;4:1318–1320. - PubMed

Publication types