Multicenter Study
. 2012 Oct;72(4):578-86.
doi: 10.1002/ana.23650.

Amyloid deposition, hypometabolism, and longitudinal cognitive decline

Affiliations
Multicenter Study

Amyloid deposition, hypometabolism, and longitudinal cognitive decline

Susan M Landau et al. Ann Neurol. 2012 Oct.

Abstract

Objective: Using data from the Alzheimer's Disease Neuroimaging Initiative (ADNI) population, we examined (1) cross-sectional relationships between amyloid deposition, hypometabolism, and cognition, and (2) associations between amyloid and hypometabolism measurements and longitudinal cognitive measurements.

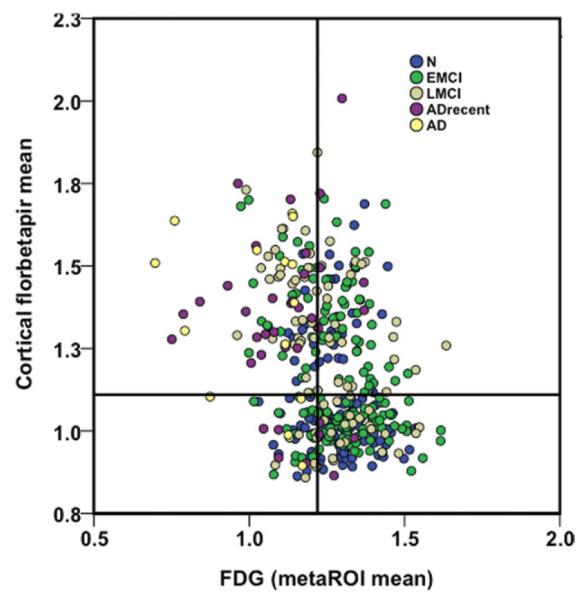
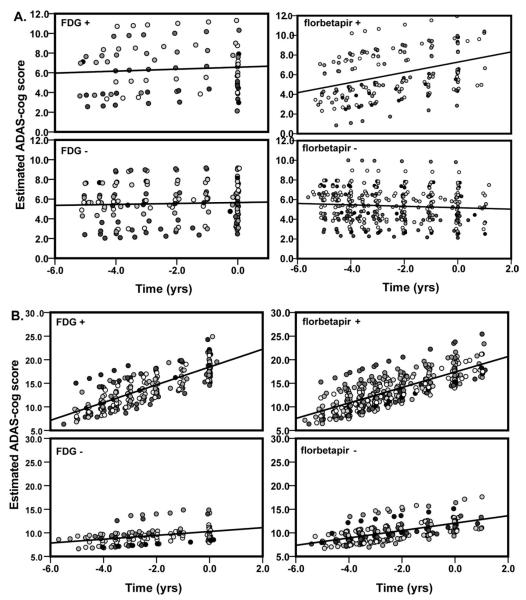
Methods: We examined associations between mean cortical florbetapir uptake, mean (18) F-fluorodeoxyglucose-positron emission tomography (FDG-PET) within a set of predefined regions, and Alzhiemer's Disease Assessment Scale (ADAS-cog) performance in 426 ADNI participants (126 normal, 162 early mild cognitive impairment [EMCI], 85 late MCI [LMCI], 53 Alzheimer disease [AD] patients). For a subset of these (76 normal, 81 LMCI) we determined whether florbetapir and FDG-PET were associated with retrospective decline in longitudinal ADAS-cog measurements.

Results: Twenty-nine percent of normal subjects, 43% of EMCI patients, 62% of LMCI patients, and 77% of AD patients were categorized as florbetapir positive. Florbetapir was negatively associated with concurrent FDG and ADAS-cog in both MCI groups. In longitudinal analyses, florbetapir-positive subjects in both normal and LMCI groups had greater ongoing ADAS-cog decline than those who were florbetapir negative. However, in normal subjects, florbetapir positivity was associated with greater ADAS-cog decline than FDG, whereas in LMCI, FDG positivity was associated with greater decline than florbetapir.

Interpretation: Although both hypometabolism and β-amyloid (Aβ) deposition are detectable in normal subjects and all diagnostic groups, Aβ showed greater associations with cognitive decline in normal participants. In view of the minimal cognitive deterioration overall in this group, this suggests that amyloid deposition has an early and subclinical impact on cognition that precedes metabolic changes. At moderate and later stages of disease (LMCI/AD), hypometabolism becomes more pronounced and more closely linked to ongoing cognitive decline.


Figures

FIGURE 1
FIGURE 1
Frequency histograms show the distributions within each diagnostic group of (A) florbetapir cortical mean (relative to the cerebellum mean) with all subjects falling to the right of the cutoff line (1.11) categorized as florbetapir and (B) concurrent 18F-fluorodeoxyglucose (FDG) meta-regions of interest (ROIs), with all subjects falling to the left of the cutoff line (1.22) categorized as FDG (see text and Table 1 for 6 percentages). Subject diagnosis was determined based on the time of the florbetapir and FDG scans. For visual comparison, subjects who originally enrolled in the Alzheimer’s Disease Neuroimaging Initiative as late mild cognitive impairment (LMCI) but converted to Alzheimer disease (AD) by the end of follow-up are shown here as an AD (recently converted) group that is separate from the AD patients who were enrolled with an AD diagnosis. EMCI = early mild cognitive impairment.
FIGURE 2
FIGURE 2
18F-Fluorodeoxyglucose (FDG) meta-region of interest (ROI) means are plotted against cortical florbetapir means for each diagnostic group. Cutoffs for each marker are described in Subjects and Methods and are labeled on the plot. The upper left and lower right quadrants represent areas of agreement between markers, whereas the upper right and lower left quadrants are areas of marker disagreement. AD = Alzheimer disease; ADrecent = Alzheimer disease recently converted; EMCI = early mild cognitive impairment; LMCI = late mild cognitive impairment; N = normal.
FIGURE 3
FIGURE 3
Plot of estimated cognitive subscale of the Alzheimer’s Disease Assessment Scale (ADAS-cog) scores (resulting from mixed effects model) relative to time in the subset of (A) normal subjects and (B) late mild cognitive impairment subjects with available follow-up data. Estimated ADAS-cog scores are plotted separately for 18F-fluorodeoxyglucose (FDG) and florbetapir and florbetapir groups. Models included terms for age, sex, and education. Separate shades represent different participants. Time (x-axis) is in years, with zero representing the time of the florbetapir or FDG scan, and the ADAS-cog measurements occurring at approximately regular intervals prior to and concurrent with the scans.

References

    1. Mosconi L, Mistur R, Switalski R, et al. FDG-PET changes in brain glucose metabolism from normal cognition to pathologically verified Alzheimer’s disease. Eur J Nucl Med Mol Imaging. 2009;36:811–822. - PMC - PubMed
    1. Drzezga A, Lautenschlager N, Siebner H, et al. Cerebral metabolic changes accompanying conversion of mild cognitive impairment into Alzheimer’s disease: a PET follow-up study. Eur J Nucl Med Mol Imaging. 2003;30:1104–1113. - PubMed
    1. Landau SM, Harvey D, Madison CM, et al. Comparing predictors of conversion and decline in mild cognitive impairment. Neurology. 2010;75:230–238. - PMC - PubMed
    1. Storandt M, Mintun MA, Head D, Morris JC. Cognitive decline and brain volume loss as signatures of cerebral amyloid-beta peptide deposition identified with Pittsburgh compound B: cognitive decline associated with Abeta deposition. Arch Neurol. 2009;66:1476–1481. - PMC - PubMed
    1. Villemagne VL, Pike KE, Chetelat G, et al. Longitudinal assessment of Abeta and cognition in aging and Alzheimer disease. Ann Neurol. 2011;69:181–192. - PMC - PubMed

Publication types

MeSH terms