. 2012 Dec 14;287(51):42936-50.
doi: 10.1074/jbc.M112.410217. Epub 2012 Oct 29.

IgG Fab fragments forming bivalent complexes by a conformational mechanism that is reversible by osmolytes

Affiliations

IgG Fab fragments forming bivalent complexes by a conformational mechanism that is reversible by osmolytes

Alfreda D Nelson et al. J Biol Chem. .

Abstract

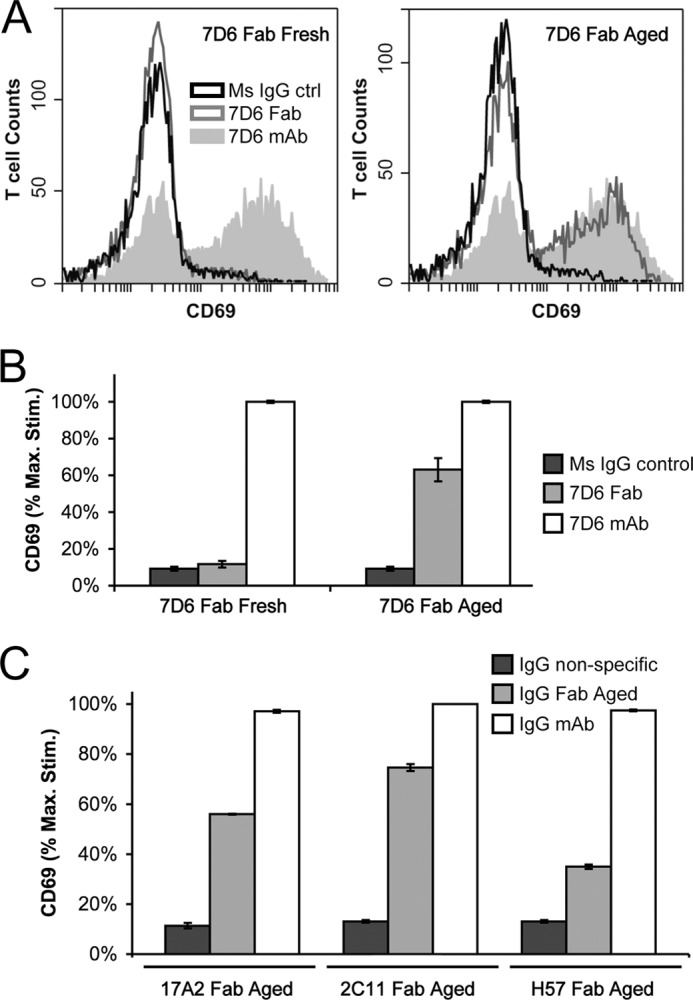
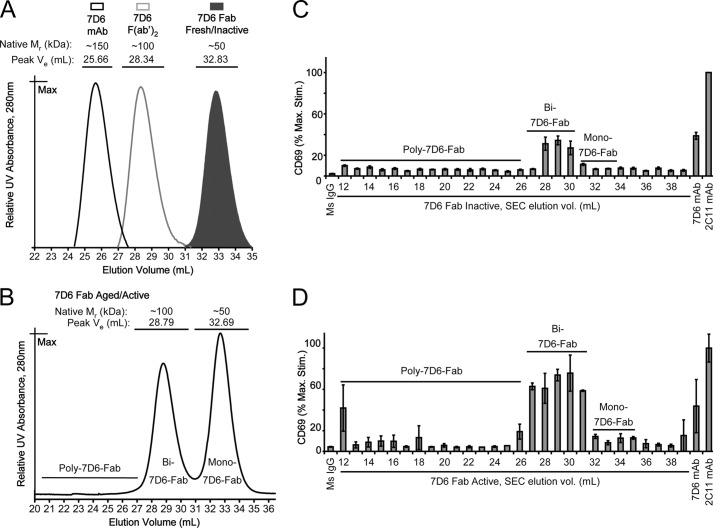
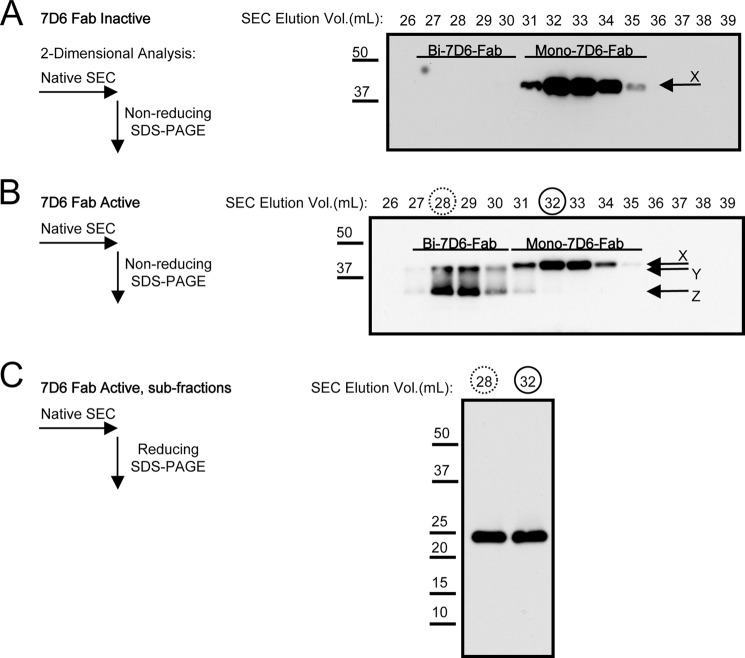
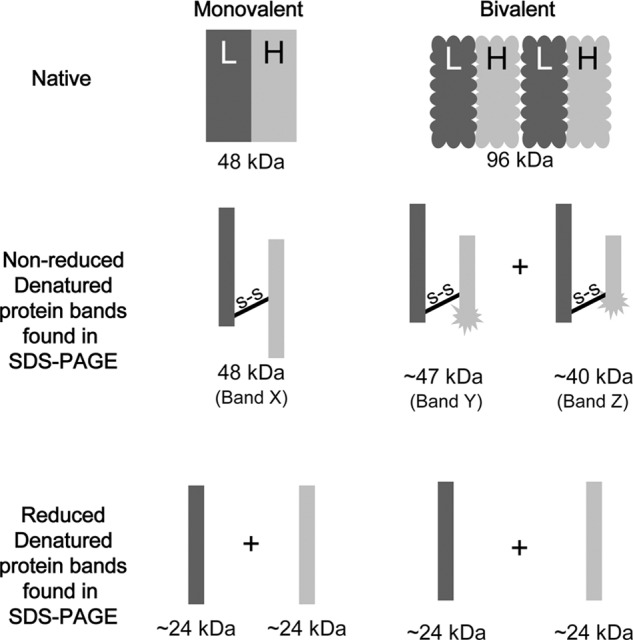
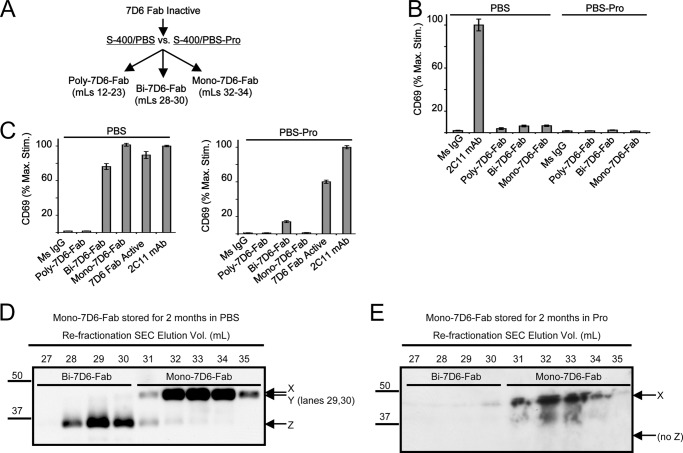
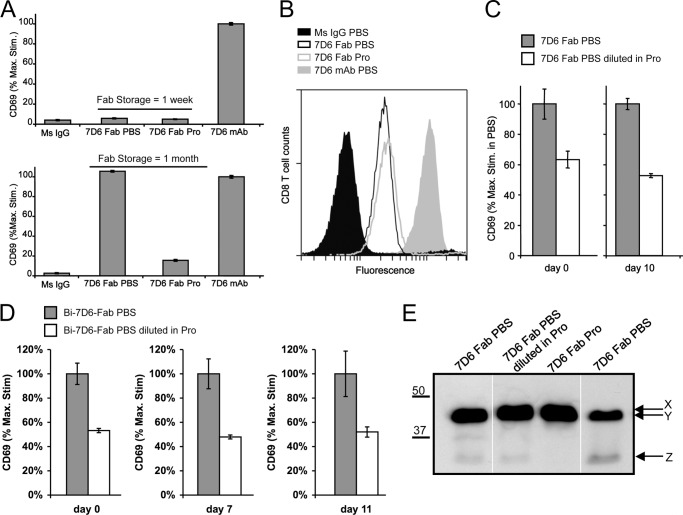
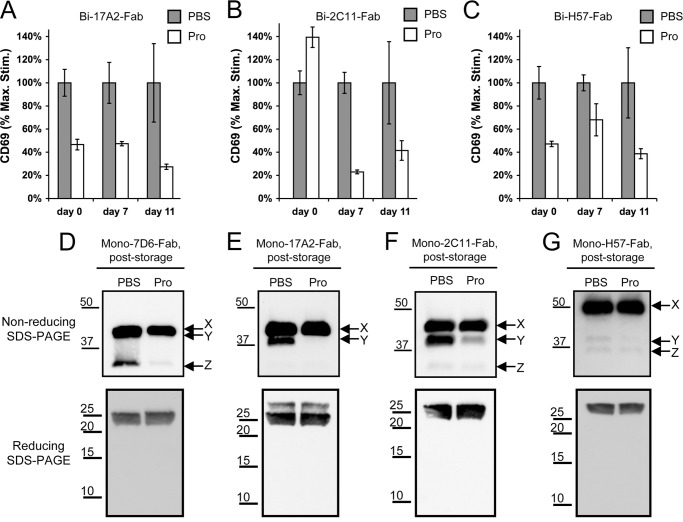
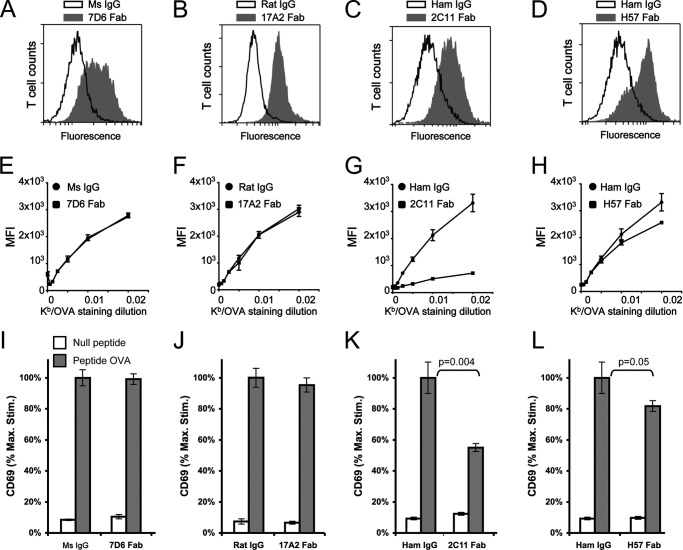
Generated by proteolytic cleavage of immunoglobulin, Fab fragments possess great promise as blocking reagents, able to bind receptors or other targets without inducing cross-linking. However, aggregation of Fab preparations is a common occurrence, which generates intrinsic stimulatory capacity and thwarts signal blockade strategies. Using a panel of biochemical approaches, including size exclusion chromatography, SDS-PAGE, mass spectrometry, and cell stimulation followed by flow cytometry, we have measured the oligomerization and acquisition of stimulatory capacity that occurs in four monoclonal IgG Fabs specific for TCR/CD3. Unexpectedly, we observed that all Fabs spontaneously formed complexes that were precisely bivalent, and these bivalent complexes possessed most of the stimulatory activity of each Fab preparation. Fabs composing bivalent complexes were more susceptible to proteolysis than monovalent Fabs, indicating a difference in conformation between the Fabs involved in these two different states of valency. Because osmolytes represent a class of compounds that stabilize protein folding and conformation, we sought to determine the extent to which the amino acid osmolyte l-proline might impact bivalent Fab complexation. We found that l-proline (i) inhibited the adoption of the conformation associated with bivalent complexation, (ii) preserved Fab monovalency, (iii) reversed the conformation of preformed bivalent Fabs to that of monovalent Fabs, and (iv) separated a significant percentage of preformed bivalent complexes into monovalent species. Thus, Fab fragments can adopt a conformation that is compatible with folding or packing of a bivalent complex in a process that can be inhibited by osmolytes.


Figures

FIGURE 1.
FIGURE 1.
Several anti-TCR/CD3 Fab fragments acquire the capacity to stimulate T cells. A and B, 7D6 Fab fragments were tested for stimulatory capacity either right after completion of papain digestion of the corresponding mAbs (7D6 Fab fresh; left panels), or after 4 months of sterile storage in PBS at 4 °C (7D6 Fab aged; right panels). A, overlays of the CD69 profiles of CD8+ T cells treated with 5 μg/ml nonspecific Ms IgG control, 7D6 Fab (fresh versus aged), or 7D6 mAb. B, replicate data for CD69 expression is represented on the y axis as a percentage of the maximum, which was observed on Thy1.2+ CD8+ T cells treated with intact 7D6 mAb. C, CD69 up-regulation test using aged Fab preparations of 17A2, 2C11, and H57 Fab at 5 μg/ml, displayed as a percentage of the maximum induction on Thy1.2+ CD8+ T cells treated with 2C11 mAb. Error bars, S.E.
FIGURE 2.
FIGURE 2.
7D6 Fab spontaneously forms a bivalent complex (Bi-7D6-Fab) that stimulates T cells. A, UV absorbance S-400 SEC elution profiles of 50 μg of 7D6 mAb, 7D6 F(ab′)2, and 7D6 Fab fresh/inactive samples. Native relative molecular weight (Mr) and peak elution volume (Ve) of each 7D6 species are noted above their corresponding elution peaks. B, S-400 SEC elution profile of an active 7D6 Fab preparation (50 μg). Two major molecular species were found: Mono-7D6-Fab and Bi-7D6-Fab. Their native Mr and peak Ve are noted above their respective elution peaks. The section of the elution profile representing higher levels of Fab aggregation is labeled as Poly-7D6-Fab. C and D, beginning with the S-400 void volume (12–12.99 ml), 28 fractions of 1 ml each were collected from the SEC of inactive (C) or active (D) 7D6 Fab preparations (even-numbered fractions are labeled, spanning 12–39 ml). Volumes of 25 μl of these fractions were tested for their capacity to stimulate B6 peripheral CD8+ T cells in the CD69 up-regulation assay and compared with nonspecific Ms IgG control, 7D6 mAb, and 2C11 mAb (all control Igs, 5 μg/ml). CD69 expression is represented on the y axis as a percentage of the maximum induction on Thy1.2+ CD8+ T cells treated with 2C11 mAbs. Fractions representing the Poly-, Bi-, and Mono-7D6-Fab species are labeled accordingly. Error bars, S.E.
FIGURE 3.
FIGURE 3.
Two-dimensional analysis of 7D6 Fab species. A and B, non-reducing SDS-PAGE of S-400 SEC fractions isolated from the inactive (A) or active (B) 7D6 Fab preparations previously shown in Fig. 2. Subsamples (5 μl) from 1-ml fractions spanning 26–39 ml were run in an 8% acrylamide/bisacrylamide gel and then transferred to nitrocellulose. Western blots were performed with donkey anti-Ms IgG Ab coupled to HRP. Fractions containing Mono-7D6-Fab and Bi-7D6-Fab species are noted at the top of the panels. The arrows indicate the different Ms IgG bands found in the 7D6 Fab fractions: X, Y, and Z. C, reducing SDS-PAGE of the Mono-7D6-Fab and Bi-7D6-Fab species isolated by S-400 SEC from fractions 28 (dotted circle) and 32 (dashed circle) from B. Subsamples (5 μl) were run in a 13% acrylamide/bisacrylamide gel and then transferred to nitrocellulose. Western blot was performed with donkey anti-Ms IgG-HRP.
FIGURE 4.
FIGURE 4.
Schematic representation of 7D6 Fab species found in different experimental conditions. In native conditions, 7D6 Fab can be found in both monovalent and bivalent species of 48 and 96 kDa, respectively (observed by SEC and MSD/TOF/MS). We propose that the bivalent species (round-edged) adopts an alternative conformation from that of the monovalent species (straight-edged). In non-reducing SDS-PAGE, monovalent Fabs generate a single band of mouse immunoglobulin (band X) that contains variable and constant domains of full-length Fab heavy and light chains. In contrast, bivalent Fabs generate two bands that migrate faster, bands Y and Z. Band Z contains intact light chain, but the heavy chain is truncated, having lost a segment of ∼8 kDa from the C terminus, a reproducible proteolytic cleavage occurring under non-reducing SDS-PAGE conditions. Band Y, migrating slightly faster (∼47 kDa) than band X (48 kDa), is not fully characterized because its proximity to band X currently prevents its isolation with high confidence. However, band Y might represent a less truncated product of non-reducing SDS-PAGE than band Z, a speculation that is represented in the schematic as a likely possibility. When monovalent and bivalent Fab species are subjected to reducing SDS-PAGE, they both generate a single band of mouse immunoglobulin of identical mobility, which contains both full-length Fab heavy and light chains.
FIGURE 5.
FIGURE 5.
Storage in l-proline prevents Mono-7D6-Fab from forming bivalent complexes and acquiring T cell stimulatory capacity. A, flow chart summarizing the protocol followed to fractionate 150 μg of an inactive 7D6 Fab preparation by S-400 SEC equilibrated either in PBS or PBS + 2 m l-proline (PBS-Pro). B, immediately following collection of 7D6 Fab fractions from S-400/PBS or S-400/PBS-Pro as depicted in A, B6 peripheral T cells were treated for 24 h with the indicated Ig species and fractions at 5 μg/ml to monitor T cell stimulation. The final concentration of l-proline was adjusted to 50 mm in the cultures related with the PBS-Pro condition. CD69 expression is represented on the y axis as a percentage of the maximum induction of CD69 on Thy1.2+ CD8+ T cells treated with 2C11 mAb in PBS. C, 7D6 Fab fractions where then stored at 4 °C for 2 months. After storage, B6 peripheral T cells were treated with the indicated IgG species and 7D6 Fab fractions at 5 μg/ml to assess CD69 up-regulation. CD69 expression is represented on the y axis as a percentage of the maximum induction of CD69 on Thy1.2+ CD8+ T cells treated with 2C11 mAb. D and E, Mono-7D6-Fab PBS and PBS-Pro fractions remaining after C were refractionated by S-400 SEC, and 28 fractions of 1 ml each were collected as described for Fig. 2, C and D. In preparation for SDS-PAGE and Western blotting, fractions were concentrated 5× by evaporation-centrifugation, and 20 μl of each concentrated fraction was subjected to non-reducing SDS-PAGE (8% acrylamide/bisacrylamide). Western blot was performed with donkey anti-Ms IgG-HRP. As was seen in Fig. 3B, excised lanes 26 and 36–39 were blank (lanes not shown). The arrows indicate the different size Ms IgG bands X, Y, and Z. Error bars, S.E.
FIGURE 6.
FIGURE 6.
l-Proline reverts some preformed Bi-7D6-Fab complexes back into Mono-7D6-Fab. A, stimulatory capacity of a 7D6 Fab preparation stored in PBS (7D6 Fab PBS) or PBS-Pro (7D6 Fab Pro) for 1 week (top) or 1 month (bottom), as measured by CD69 up-regulation on B6 peripheral T cells. All IgG controls and Fab samples were tested at 5 μg/ml. CD69 expression is represented on the y axes as a percentage of the maximum induction of CD69 on Thy1.2+ CD8+ T cells treated with 7D6 mAb. B, CD3 cell surface staining on B6 peripheral CD8+ T cells by 7D6 Fab PBS and 7D6 Fab Pro shown in A after 2 months of storage. All IgG controls and Fab samples were tested at 5 μg/ml. C, aliquots of the 7D6 Fab PBS shown as active in A (bottom) were diluted in either PBS or PBS-Pro (Pro) and then retested at 5 μg/ml for their T cell stimulatory capacity in a CD69 up-regulation assay on the day of dilution (day 0, left), and after 10 days of storage at 4 °C (day 10, right). CD69 expression is represented for each time point on the y axis as a percentage of the maximum induction of CD69 on B6 Thy1.2+ CD8+ T cells treated with the active 7D6 Fab PBS diluted in PBS. D, two aliquots of a Bi-7D6-Fab obtained by the S-400/PBS SEC fractionation protocol summarized in Fig. 4A were diluted either in PBS or PBS-Pro (Pro). The resulting Fab samples were tested at 5 μg/ml for their capacity to stimulate B6 peripheral T cells immediately upon dilution (day 0) or after 7 and 10 days of storage at 4 °C. CD69 expression is represented on the y axis as a percentage of the maximum induction of CD69 on Thy1.2+ CD8+ T cells treated with the Bi-7D6-Fab diluted in PBS. E, 0.5-μg samples of the 7D6 Fab PBS shown as active in A (bottom), the same 7D6 Fab PBS diluted in Pro as shown in C, and the 7D6 Fab Pro shown as inactive in A were subjected to non-reducing SDS-PAGE in an 8% acrylamide/bisacrylamide gel and transferred to nitrocellulose for Western blotting with donkey anti-Ms IgG-HRP. An additional sample from another batch of active 7D6 Fab stored in PBS (7D6 Fab PBS) was loaded at the right end of the gel to aid in the identification of bands X, Y, and Z. The arrows indicate these bands as described in the legends to Figs. 3 and 5. Error bars, S.E.
FIGURE 7.
FIGURE 7.
l-Proline decreases the stimulatory capacity of anti-TCR/CD3 Fabs while stabilizing a conformation associated with monovalency. A–C, fractions identified in supplemental Fig. 2 as containing Bi-Fab species of 17A2, 2C11, and H57 Fabs were diluted in either PBS or PBS-Pro (Pro). Aliquots of the resulting dilutions were tested for their T cell stimulatory activity in a CD69 up-regulation assay with B6 peripheral T cells on days 0 (the day of dilution), 7, and 11. CD69 expression is represented for each time point on the y axis as a percentage of the maximum induction of CD69 on B6 Thy1.2+ CD8+ T cells treated with PBS-stored, active Fabs diluted in PBS. D–G, Mono-Fab species were isolated by S-400 SEC fractions in PBS for 7D6 (D), 17A2 (E), 2C11 (F), and H57 (G). Immediately following fractionation, these Mono-Fab species were diluted in either PBS or PBS-Pro (Pro) and stored for 2 months at 4 °C. At this point, subsamples of 0.5 μg were subjected to either non-reducing (8% acrylamide/bisacrylamide; top panels) or reducing SDS-PAGE (13% acrylamide/bisacrylamide; bottom panels), followed by transfer to nitrocellulose membranes for Western blots. The arrows indicate the different size IgG bands X, Y, and Z found in each sample. Error bars, S.E.
FIGURE 8.
FIGURE 8.
Storage in PBS-Pro is compatible with anti-TCR/CD3 Fab-mediated inhibition of T cell stimulation. A–D, OT-I peripheral T cells were incubated with the indicated anti-TCR/CD3 Fabs that had been stored in PBS-Pro or with matching nonspecific IgG controls, all at 5 μg/ml for 60 min on ice. Following incubation, the cells were washed and stained with corresponding FITC-labeled secondary anti-IgG Abs and APC-labeled anti-Thy1.2 mAb. Histograms show the staining of the OT-I TCR/CD3 complex on Thy1.2+ T cells (anti-IgG-FITC fluorescence, x axis). E–H, antigen binding to the OT-I TCR in the presence of PBS-Pro-stored anti-TCR/CD3 Fabs. OT-I peripheral T cells incubated with the indicated PBS-Pro-stored Fabs or nonspecific IgG controls were subsequently stained with a serial dilution of a Kb/OVA-PE tetramer and APC-labeled anti-Thy1.2 mAb. Graphs show the Kb/OVA-PE staining dilution tested on x axes and Kb/OVA-PE mean fluorescence intensity (MFI) ± S.E. on Thy1.2+ T cells on y axes. I–L, CD69 up-regulation assay of OT-I thymocytes preincubated with the indicated PBS-Pro-stored Fabs or nonspecific IgG controls at 5 μg/ml and subsequently co-cultured with T2-Kb cells preloaded with 2 μm null versus antigenic peptide (OVA). After 24 h, the co-cultures were stained with anti-Thy.1.2-PerCP, anti-CD8α-APC, anti-Vβ5-FITC, and anti-CD69-PE mAbs. Graphs show CD69 expression on OT-I thymocytes (y axis) as a percentage of the maximum stimulation observed on Thy1.2+ CD8+ Vβ5+ thymocytes when co-cultured with T2-Kb APCs loaded with the peptide OVA and treated with the nonspecific IgG control. Error bars, S.E.

Similar articles

Cited by

References

    1. Andrew S. M., Titus J. A. (2001) Fragmentation of immunoglobulin G. Curr. Protoc. Immunol., Chapter 2, Unit 2.8 - PubMed
    1. Porter R. R. (1958) Separation and isolation of fractions of rabbit γ-globulin containing the antibody and antigenic combining sites. Nature 182, 670–671 - PubMed
    1. Porter R. R. (1959) The hydrolysis of rabbit γ-globulin and antibodies with crystalline papain. Biochem. J. 73, 119–126 - PMC - PubMed
    1. Anderson D. E., Bieganowska K. D., Bar-Or A., Oliveira E. M., Carreno B., Collins M., Hafler D. A. (2000) Paradoxical inhibition of T-cell function in response to CTLA-4 blockade. Heterogeneity within the human T-cell population. Nat. Med. 6, 211–214 - PubMed
    1. Kearney E. R., Walunas T. L., Karr R. W., Morton P. A., Loh D. Y., Bluestone J. A., Jenkins M. K. (1995) Antigen-dependent clonal expansion of a trace population of antigen-specific CD4+ T cells in vivo is dependent on CD28 costimulation and inhibited by CTLA-4. J. Immunol. 155, 1032–1036 - PubMed

Publication types

MeSH terms

LinkOut - more resources