. 2013 Jan;33(1):98-110.
doi: 10.1128/MCB.01075-12. Epub 2012 Oct 29.

Defective autophagy and mTORC1 signaling in myotubularin null mice

Affiliations

Defective autophagy and mTORC1 signaling in myotubularin null mice

Kristina M Fetalvero et al. Mol Cell Biol. 2013 Jan.

Abstract

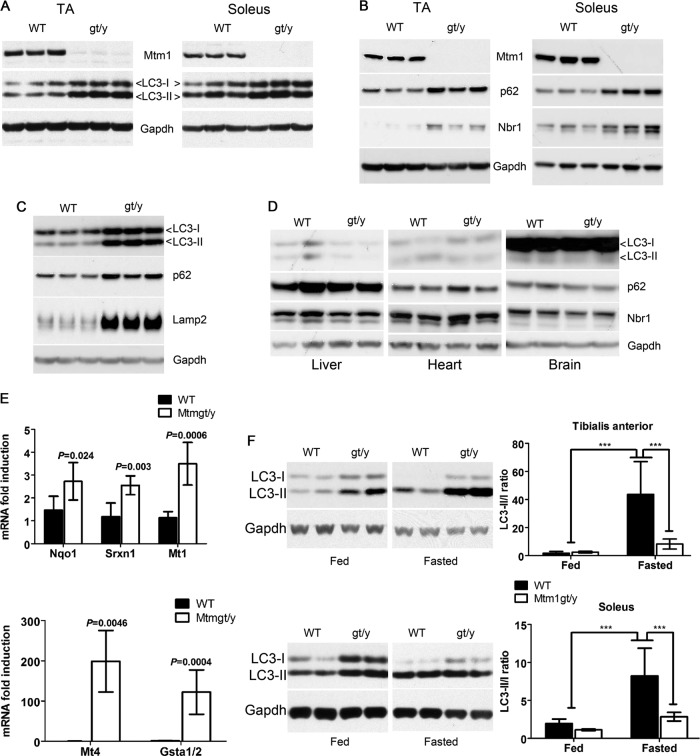
Autophagy is a vesicular trafficking pathway that regulates the degradation of aggregated proteins and damaged organelles. Initiation of autophagy requires several multiprotein signaling complexes, such as the ULK1 kinase complex and the Vps34 lipid kinase complex, which generates phosphatidylinositol 3-phosphate [PtdIns(3)P] on the forming autophagosomal membrane. Alterations in autophagy have been reported for various diseases, including myopathies. Here we show that skeletal muscle autophagy is compromised in mice deficient in the X-linked myotubular myopathy (XLMTM)-associated PtdIns(3)P phosphatase myotubularin (MTM1). Mtm1-deficient muscle displays several cellular abnormalities, including a profound increase in ubiquitin aggregates and abnormal mitochondria. Further, we show that Mtm1 deficiency is accompanied by activation of mTORC1 signaling, which persists even following starvation. In vivo pharmacological inhibition of mTOR is sufficient to normalize aberrant autophagy and improve muscle phenotypes in Mtm1 null mice. These results suggest that aberrant mTORC1 signaling and impaired autophagy are consequences of the loss of Mtm1 and may play a primary role in disease pathogenesis.


Figures

Fig 1
Fig 1
Generation of Mtm1gt/y mice. (A) Diagram representing the Mtm1 gene trapped mutant allele and resulting mutant mRNA transcript. The arrows indicate the primers used for reverse transcription-PCR analysis. (B) Genotyping of WT and Mtm1gt/y mice. PCR analysis of genomic DNA from mouse tails using primers A, B, and C shown in panel A. The Mtm1 gene trap specific band (mutant allele) is present only in Mtm1gt/y mice. (C) Mtm1gt/y (gt/y) mice are null for Mtm1 expression. Protein lysates from muscle, heart, liver, and brain tissues were subjected to immunoblot analysis with the indicated antibodies. (D) PtdIns(3)P levels were measured in lipid extracts from muscle tissue by ELISA. Concentrations were corrected for body weight. Values are means ± standard deviations (n ≥ 3 per group).
Fig 2
Fig 2
Muscle phenotype of Mtm1gt/y mice. (A) Growth curves of WT and Mtm1gt/y (gt/y) mice. A significant difference between Mtm1gt/y and WT mice was observed after 29 days. (B to E) H&E staining of cross sections of soleus (B) and TA (C) muscles of 4-week-old mice reveals a smaller fiber size in Mtm1gt/y muscle and fibrosis with inflammatory cell infiltration in the soleus muscle (arrowheads). Centralized nuclei (arrows) can be found in TA muscles of 6-week-old Mtm1gt/y mice (D). Longitudinal sections of TA muscles of 5-week-old mice show disruption of nuclear positioning along muscle fibers (E). (F) Quantification of the cross-sectional area (CSA) of myofibers from TA and soleus muscles. Values are means ± standard deviations (***, P < 0.001). The numbers of animals are indicated in the respective bars. (G) Histograms showing the distribution of cross-sectional areas (μm2) in panel F. (H) Electron micrographs of WT and MTM1gt/y TA muscles. In longitudinal sections, Z-line misalignment and a dilated sarcoplasmic reticulum (arrowheads) are evident in Mtm1gt/y mice. Scale bars, 100 nm. (I) Protein lysates were extracted from TA or soleus muscles and analyzed by Western blotting for levels of desmin and Mtm1. Immunoblot assays for GAPDH are shown to verify equal protein loading. (J) Weights of TA and soleus muscles. The number of animals per group is indicated in each respective bar. Values are means ± standard deviations (***, P < 0.001). (K) The forelimb grip strength of 3- and 4-week-old WT and Mtm1gt/y mice was measured and normalized to their weight. Values are means ± standard deviations (WT, n = 10 mice; Mtm1gt/y, n = 6 mice;**, P < 0.01; ***, P < 0.001).
Fig 3
Fig 3
Defective autophagy in Mtm1-deficient mice. (A) Immunoblot analysis of LC3 and Mtm1 in muscle homogenates from TA and soleus muscles of 4-week-old Mtm1gt/y (gt/y) and WT mice. (B) Immunoblot analysis of p62 and Nbr1 in TA and soleus muscles of WT and Mtm1gt/y (gt/y) mice. (C) Protein lysates were extracted from either WT or Mtm1gt/y (gt/y) muscles and subjected to Western blotting for LC3, p62, and Lamp2. (D) Immunoblot analysis for LC3, p62, and Nbr1 in brain, heart, and liver homogenates from WT and Mtm1gt/y mice. (E) Quantitative PCR analysis of stress response enzymes in WT and Mtm1gt/y TA muscles. Expression values were normalized to GAPDH. Data are expressed as fold induction relative to that in the WT. Values are means ± standard deviations (P values are indicated in the graph; n = 5 mice per group). Nqo1, NAD(P)H dehydrogenase quinone 1; Srxn1, sulfiredoxin 1; Mt1, metallothionein 1; Mt4, metallothionein 4; GSTa1/2, glutathione S-transferase α1/α2. (F) Western blot assay for LC3 in protein lysates from TA and soleus muscles of WT or Mtm1gt/y (gt/y) mice either fed or fasted for 20 h. Relative band intensities were quantified and used to determine the ratio of LC3-II to LC3-I and are represented in the graph. Values are means ± standard deviations (n ≥ 4 mice per group; ***, P < 0.001 [relative to fasted WT mice]).
Fig 4
Fig 4
Accumulation of ubiquitin aggregates in Mtm1gt/y muscle. (A) Immunoblot analysis of ubiquitin in 1% Triton X-100 detergent-soluble and insoluble fractions of muscle homogenates from 5-week-old mice. GAPDH was used as a loading control for the soluble fraction, and β-actin was used as a loading control for the insoluble fraction. (B) Accumulation of p62 and Nbr1 in both the detergent-soluble and insoluble fractions. Homogenates from mice were fractionated and analyzed by immunoblotting as described for panel A. (C and D) Immunofluorescent staining for ubiquitin (C) and p62 (D) shows the presence of aggregates in Mtm1gt/y but not in WT muscles. DAPI, 4′,6-diamidino-2-phenylindole.
Fig 5
Fig 5
Abnormal mitochondria in Mtm1 null muscle. (A to D) Electron micrographs of TA muscles from 5-week-old WT (A and B) and Mtm1gt/y (C and D) mice. Scale bars, 500 nm (A and C) and 100 nm (B and D). (E and F) Cross sections of TA muscle stained for SDH (E) and COX (F) activities. Fibers with dense subsarcolemmal (“ring”) staining in Mtm1-deficient TA are indicated (arrows). (G) Quantification (see Materials and Methods) of relative differences in the intensity of enzyme activity staining for SDH (E) and COX (F) in TA muscles from WT and Mtm1gt/y mice. Data are means ± standard deviations (P values are indicated in the graph; n = 3 mice per group). (H) COX enzyme activity of whole muscle homogenates from WT and Mtm1gt/y mice. Values are means ± standard deviations (n = 3 mice per genotype).
Fig 6
Fig 6
Aberrant mTORC1 signaling in Mtm1gt/y muscle. (A) TA muscles from WT and Mtm1gt/y mice fed or fasted for 20 h were subjected to immunoblot analysis with the indicated antibodies. (B) Immunoblot analysis for P-S6 and P-4EBP1 in brain, heart, or liver homogenates from WT and Mtm1gt/y mice. (C) TA muscles from WT and Mtm1gt/y mice fed or fasted for 24 h were subjected to immunoblot analysis for S6Ser240/244, S6, 4EBP1Thr37/46, and AKTSer473. Relative band intensities were quantified and are represented in the graph. Values are means ± standard deviations (*, P < 0.05 [relative to fed WT mice]; **, P < 0.01 [relative to fed WT mice]; ***, P < 0.001 [relative to fed WT mice]; ++, P < 0.01 [relative to fed Mtm1gt/y mice]; +++, P < 0.001 [relative to fed Mtm1gt/y mice]; ##, P < 0.01 [relative to fasted WT mice]; ###, P < 0.001 [relative to fasted WT mice]). AU, arbitrary units. (D) TA muscles from WT and Mtm1gt/y mice fed or fasted for 10 h were subjected to immunoblot analysis with the indicated antibodies.
Fig 7
Fig 7
Inhibition of mTOR corrects the autophagy defect in Mtm1gt/y muscle. Mice were treated with the vehicle, RAD001 (10 mg/kg), or AZD8055 (25 mg/kg) for 1 h (A) or 5 consecutive days (B). Muscle protein was isolated for immunoblot analysis for P-S6K1, P-4EBP1, and LC3. (C) Immunoblot analysis for LC3, P-ULK1, P-S6K1, and P-4EBP1 in gastrocnemius muscles of WT and Mtm1gt/y mice treated with the vehicle control or AZD8055 (10 mg/kg four times a day) for the indicated times. Values are means ± standard deviations (n ≥ 2 mice per group; **, P < 0.01; ***, P < 0.001 [relative to the vehicle-treated control]). (D) Immunoblot analysis for p62 and Lamp2 in muscles of WT and Mtm1gt/y mice treated with AZD8055 for 3 days. Relative band intensities were quantified and are represented in the graph. Values are means ± standard deviations (*, P < 0.05; ***, P < 0.001 [relative to vehicle-treated Mtm1gt/y mice]; #, P < 0.05; ##, P < 0.01 [relative to AZD8055-treated Mtm1gt/y mice]; +++, P < 0.001 [relative to AZD8055-treated WT mice]; n ≥ 3 mice per group).
Fig 8
Fig 8
AZD8055 improves muscle mass and reduces abnormal desmin accumulation in Mtm1gt/y muscle. (A) Weights of muscles from WT or Mtm1gt/y mice treated with AZD8055 for 3 days. The number of animals per group is indicated in the graph. Values are means ± standard deviations (*, P < 0.05; ***, P < 0.001 [relative to vehicle-treated Mtm1gt/y mice]; ##, P < 0.01 [relative to AZD8055-treated Mtm1gt/y mice]; n ≥ 3 mice per group). MW, muscle weight; BW, body weight. (B) Mice were treated with the vehicle or AZD8055 for 2 weeks. Protein lysates were extracted from muscle for immunoblot analysis for desmin. Relative band intensities were quantified and are represented in the graph. Values are means ± standard deviations (**, P < 0.01 [relative to vehicle-treated Mtm1gt/y mice]).

References

    1. Levine B, Kroemer G. 2008. Autophagy in the pathogenesis of disease. Cell 132: 27– 42 - PMC - PubMed
    1. Hara T, Nakamura K, Matsui M, Yamamoto A, Nakahara Y, Suzuki-Migishima R, Mishima K, Saito I, Okano H, Mizushima N. 2006. Suppression of basal autophagy in neural cells causes neurodegenerative disease in mice. Nature 441: 885– 889 - PubMed
    1. Komatsu M, Waguri S, Chiba T, Murata S, Iwata J, Tanida I, Ueno T, Koike M, Uchiyama Y, Kominami E, Tanaka K. 2006. Loss of autophagy in the central nervous system causes neurodegeneration in mice. Nature 441: 880– 884 - PubMed
    1. Komatsu M, Waguri S, Koike M, Sou Y, Ueno T, Hara T, Mizushima N, Ezaki J, Murata S, Hamazaki J, Nishito Y, Iemura S, Yanagawa T, Uwayama J, Warabi E, Yoshida H, Ishii T, Kobayashi A, Yamamoto M, Yue Z, Uchiyama Y, Kominami E, Tanaka K. 2007. Homeostatic levels of p62 control cytoplasmic inclusion body formation in autophagy-deficient mice. Cell 131: 1149– 1163 - PubMed
    1. Nakai A, Yamaguchi O, Takeda T, Higuchi Y, Hikoso S, Taniike M, Omiya S, Matsumura Y, Asahi M, Nishida K, Hori M, Mizushima N, Otsu K. 2007. The role of autophagy in cardiomyocytes in the basal state and in response to hemodynamic stress. Nat. Med. 13: 619– 624 - PubMed

MeSH terms

LinkOut - more resources