. 2013 Jan;33(2):227-36.
doi: 10.1128/MCB.00881-12. Epub 2012 Oct 29.

The forkhead transcription factor FOXM1 controls cell cycle-dependent gene expression through an atypical chromatin binding mechanism

Affiliations

The forkhead transcription factor FOXM1 controls cell cycle-dependent gene expression through an atypical chromatin binding mechanism

Xi Chen et al. Mol Cell Biol. 2013 Jan.

Abstract

There are nearly 50 forkhead (FOX) transcription factors encoded in the human genome and, due to sharing a common DNA binding domain, they are all thought to bind to similar DNA sequences. It is therefore unclear how these transcription factors are targeted to specific chromatin regions to elicit specific biological effects. Here, we used chromatin immunoprecipitation followed by sequencing (ChIP-seq) to investigate the genome-wide chromatin binding mechanisms used by the forkhead transcription factor FOXM1. In keeping with its previous association with cell cycle control, we demonstrate that FOXM1 binds and regulates a group of genes which are mainly involved in controlling late cell cycle events in the G(2) and M phases. However, rather than being recruited through canonical RYAAAYA forkhead binding motifs, FOXM1 binding is directed via CHR (cell cycle genes homology region) elements. FOXM1 binds these elements through protein-protein interactions with the MMB transcriptional activator complex. Thus, we have uncovered a novel and unexpected mode of chromatin binding of a FOX transcription factor that allows it to specifically control cell cycle-dependent gene expression.


Figures
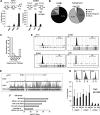
Fig 1
Fig 1
FOXM1 binds to the promoter regions of genes involved in late cell cycle control. (A) ChIP analysis of FOXM1 binding to the PLK1 and CCNB2 promoters in asynchronously growing U2OS cells, using the indicated primer pairs. (B) Distribution of FOXM1 ChIP-seq regions (left) compared to the total genomic DNA distribution (right). The sector corresponding to the promoter includes sequences up to 1 kb upstream from the TSS or in the 5′ UTR. (C) Distribution of peaks summit distances from the TSS. (D) Screenshot from the UCSC browser showing the distribution of FOXM1 and FOXK2 binding peaks in U2OS cells across chromosome 10. (E) Example FOXM1 binding peak profiles for the indicated genes. (F) The top five overrepresented gene ontology (GO) terms in genes associated with FOXM1 binding regions. (G) ChIP analysis of FOXM1 binding to the PLK1 and CCNB2 promoters in U2OS cells released from a double thymidine block for the indicated times, using the indicated primer pairs. DNA content profiles of U2OS cells at the indicated time points following release from a double thymidine block are shown above the graph. DNA content is determined by propidium iodide (PI) staining and peaks corresponding to cells before (2n) and after (4n) DNA replication are shown.
Fig 2
Fig 2
FOXM1 directly activates late cell cycle genes. (A) ChIP-qPCR validation of FOXM1 binding to regions associated with the indicated genes. Experiments were carried out with three biological repeats. Bars indicate the average percentages of input precipitated with the FOXM1 antibody or nonspecific IgG with the standard deviations. The numbers above each set of bars represent the fold increase in signal with FOXM1 over IgG. (B) Heat map from an expression microarray analysis performed in HeLa cells after release from a double thymidine block (25) of the 270 genes that are associated with FOXM1 binding regions. The graph below summarizes the average Z score of the expression profiles of this group of genes. (C and E) RT-qPCR analysis of the expression of the indicated genes in U2OS cells grown asynchronously (C) or subjected to a double thymidine block and released for the indicated times (E). Cells were pretreated with a nontargeting siRNA (siCon) or siRNA against FOXM1. The data are the averages of two (E) or three (C) experiments and are shown for each gene relative to its expression in the presence of the control siRNA (taken as 1 [C]) or the internal control gene HMBS (E). ** and * represent P values of <0.01 and <0.05, respectively. (D) DNA content profiles of U2OS cells at the indicated time points following release from a double thymidine block. DNA content is determined by propidium iodide (PI) staining, and peaks corresponding to cells before (2n) and after (4n) DNA replication are shown.
Fig 3
Fig 3
FOXM1 binds to CHR-containing regions and interacts with the MMB complex. (A) TFBS logos for the two top ranking motifs identified by HOMER when searching ±100 bp from the summits of the FOXM1-bound regions. (B) Frequency of CCAAT, CHR, and forkhead DNA binding motif occurrence in 20-bp bins relative to the summits of the FOXM1 binding regions. (C) Heat maps showing FOXM1, LIN9, and B-MYB ChIP-seq tag densities in the 10-kb region surrounding the summit of the FOXM1 binding regions. Regions are clustered using K-means linear clustering according to similar tag density profiles. The graphs on the right show the mean tag densities across all regions in either the “shared” or “unique” categories of binding regions for these proteins. (D) Coimmunoprecipitation analysis (IP) of GFP alone (−) or GFP-tagged FOXM1b or FOXM1c and the indicated endogenously expressed DREAM and MMB complex proteins from HEK293 cells.
Fig 4
Fig 4
FOXM1 is recruited via the CHR element. (A) Transient reporter gene assay on wild-type (WT) and mutant (ΔCDE and ΔCHR) CCNB1-driven luciferase reporters in U2OS cells in the presence or absence (Vec) of FOXM1. The data are averages of three independent experiments. (B) Transient reporter gene assays in NIH 3T3 cells with vector control (−) or wild-type (WT) or mutant (ΔCHR) Ccnb1-driven luciferase genes. NIH 3T3 cells were treated with control siRNAs (siFoxM1: −) or siRNA against FoxM1 (+) and blocked in G0 by serum deprivation and released for 24 h to accumulate in G2-M. The data are averages of duplicate experiments. (C) ChIP assays of transiently transfected Flag-tagged FOXM1 in HCT116 cells containing wild-type (WT) or mutant (ΔCHR) stably integrated mouse Ccnb2 transgenes. ChIP was performed with nonspecific IgG or anti-Flag antibodies; the data are the averages of two experiments and are presented as binding to each transgene relative to binding to the endogenous locus.
Fig 5
Fig 5
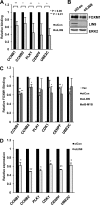
FOXM1 recruitment depends on the MMB complex. (A) ChIP assay of endogenous FOXM1 was performed in U2OS cells on the promoters of the indicated genes after knockdown of LIN9 or in the presence of a nontargeting control siRNA (siCon). (B) Western blot of FOXM1 and LIN9 levels after knockdown of LIN9 or in the presence of a nontargeting control siRNA (siCon). ERK2 represents a loading control. (C) ChIP assays of transiently transfected Flag-tagged FOXM1 in HEK293T cells. FOXM1 ChIP was performed on promoters of the indicated genes after knockdown of LIN9 or B-MYB or in the presence of a nontargeting control siRNA (siCon). “Vec” represents cells transfected with empty vector. The data for both ChIP experiments are the average of two independent experiments. ** and * represent P values of <0.01 and <0.05, respectively. (D) RT-qPCR analysis of the expression of the indicated genes in asynchronously growing U2OS cells. Cells were treated with a nontargeting siRNA (siCon) or a siRNA against LIN9. The data are the average of two experiments and are shown for each gene relative to its expression in the presence of the control siRNA (taken as 1). ** and * represent P values of <0.001 and <0.01, respectively.
Fig 6
Fig 6
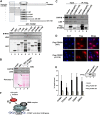
FOXM1 is recruited indirectly via the MMB complex to CHR elements. (A and B) GST pulldown assay using the indicated GST-FOXM1 fusion proteins and total cell extracts from U2OS cells. Ethidium bromide (EtBr) was added to the GST pulldown reactions where indicated. Interacting LIN9 and B-MYB proteins were revealed by Western blotting (upper panels) and Coomassie or Ponceau S stained input GST fusion proteins are shown below. A total of 3% cell lysate input is shown (lane 1). Arrows represent bands corresponding to full-length GST fusion proteins. Asterisks indicate a cross-reacting GST fusion protein band. (C) Coimmunoprecipitation (IP) analysis from U2OS cells expressing the indicated Flag-tagged FOXM1 fusion proteins. Precipitated and coprecipitated proteins were detected by immunoblotting with the indicated antibodies (left). A total of 3% cell lysate input is shown (lanes 1 to 3). (D) FOXM1(Δ1-116) is localized to the nucleus. U2OS cells were transfected with plasmids encoding Flag-tagged version of full-length wild-type (WT) and a Δ1-116 version of FOXM1, and expression was detected by immunofluorescence with anti-Flag antibody. Nuclei are revealed by using DAPI (4′,6′-diamidino-2-phenylindole) staining. A merge of the two stains is shown on the right. (E) ChIP assays of transiently transfected Flag-tagged FOXM1 in HEK293T cells. Cells were transfected with empty vector or wild-type (WT) or mutant (Δ1-116/ΔN) versions of FOXM1 prior to ChIP for Flag-tagged FOXM1 on the indicated genes. Expression levels were revealed by Western analysis with anti-flag antibody (inset). The data are the averages of two independent experiments. (F) Model showing recruitment of FOXM1 to the CHR element through MMB complex binding. FOXM1 is linked to the cell cycle through activation by cell cycle-regulated kinases.

References

    1. Carlsson P, Mahlapuu M. 2002. Forkhead transcription factors: key players in development and metabolism. Dev. Biol. 250: 1–23 - PubMed
    1. Hannenhalli S, Kaestner KH. 2009. The evolution of Fox genes and their role in development and disease. Nat. Rev. Genet. 10: 233–240 - PMC - PubMed
    1. Breeden LL. 2000. Cyclin transcription: timing is everything. Curr. Biol. 10: R586–R588 - PubMed
    1. Alvarez B, Martinez AC, Burgering BM, Carrera AC. 2001. Forkhead transcription factors contribute to execution of the mitotic programme in mammals. Nature 413: 744–747 - PubMed
    1. Laoukili J, Kooistra MR, Bras A, Kauw J, Kerkhoven RM, Morrison A, Clevers H, Medema RH. 2005. FoxM1 is required for execution of the mitotic programme and chromosome stability. Nat. Cell Biol. 7: 126–136 - PubMed

Publication types

MeSH terms