. 2012 Nov 19;209(12):2307-19.
doi: 10.1084/jem.20121752. Epub 2012 Oct 29.

Analysis of a wild mouse promoter variant reveals a novel role for FcγRIIb in the control of the germinal center and autoimmunity

Affiliations

Analysis of a wild mouse promoter variant reveals a novel role for FcγRIIb in the control of the germinal center and autoimmunity

Marion Espéli et al. J Exp Med. .

Abstract

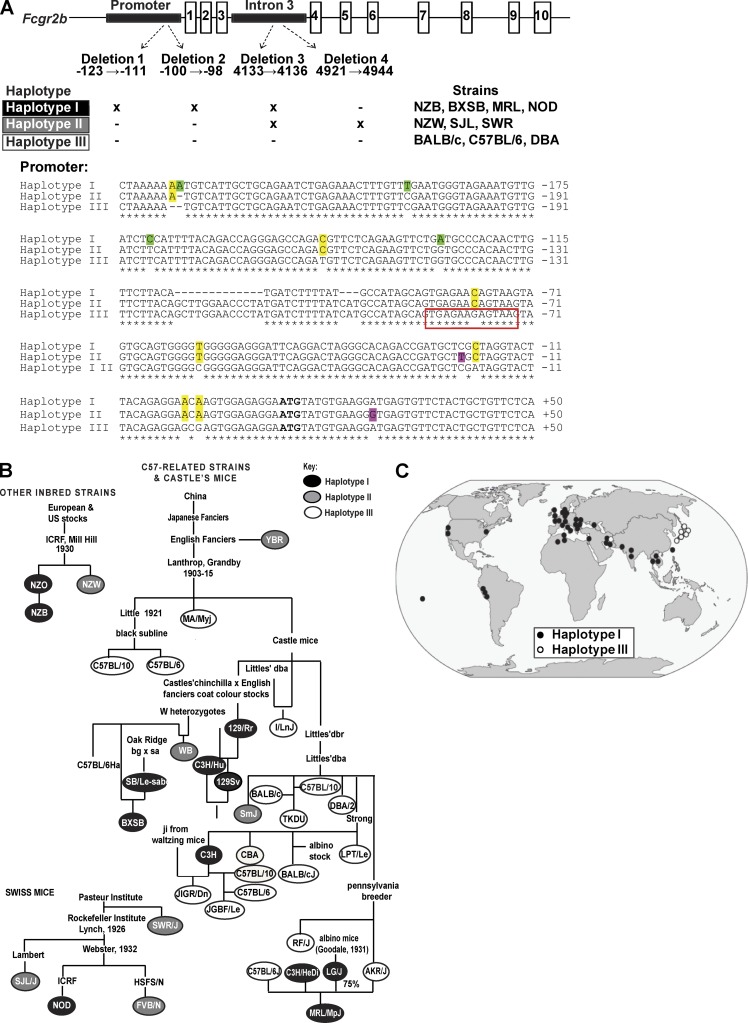
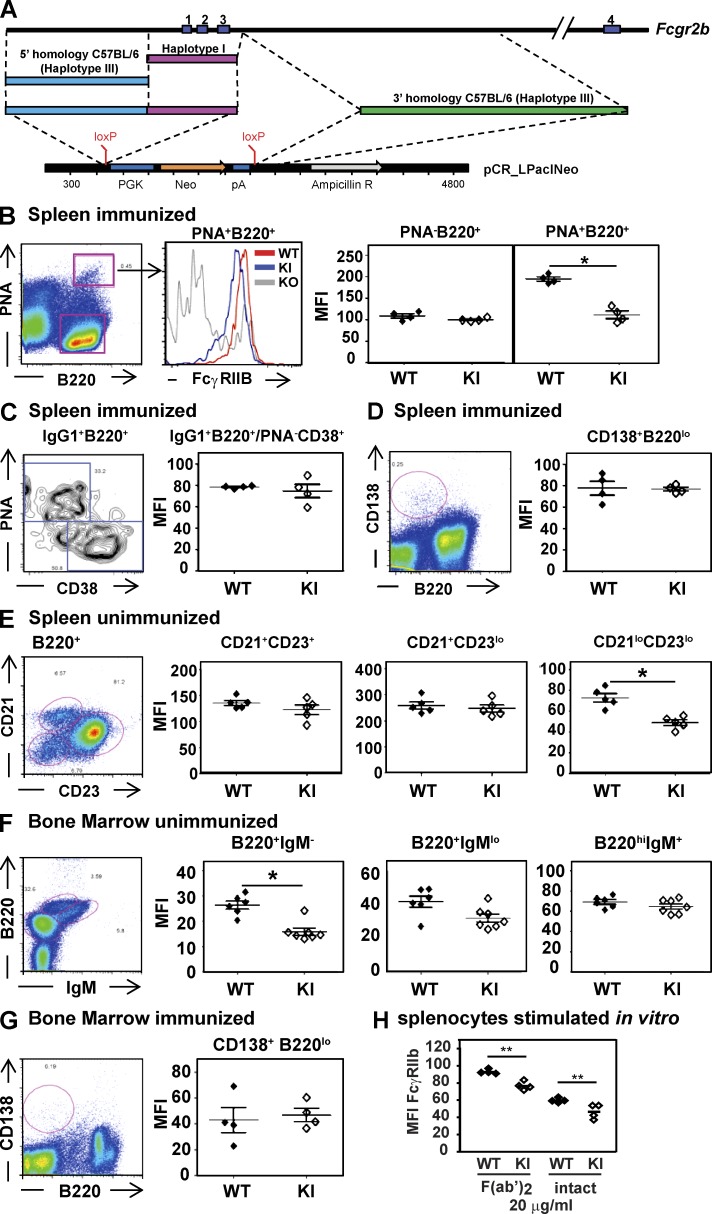
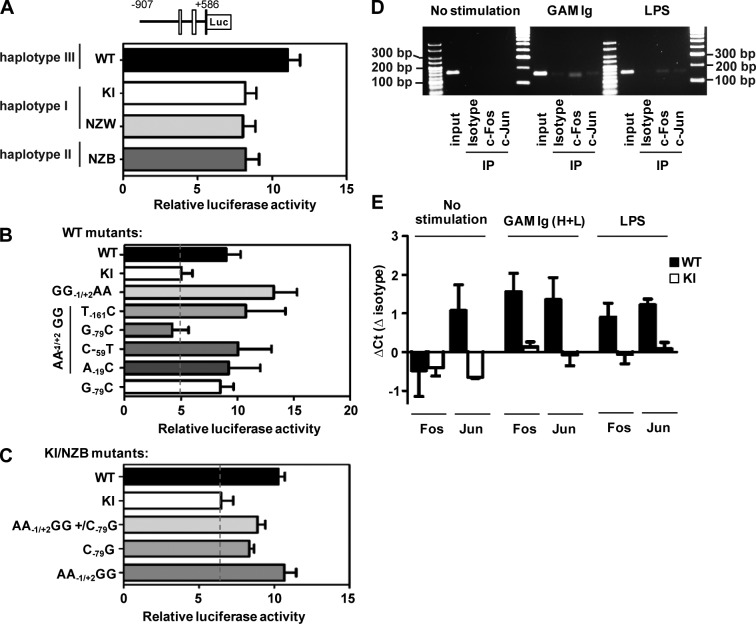
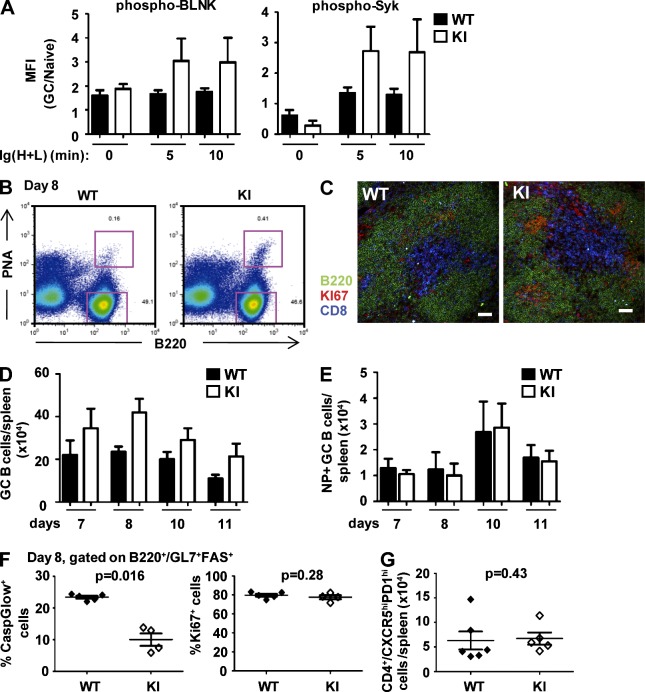
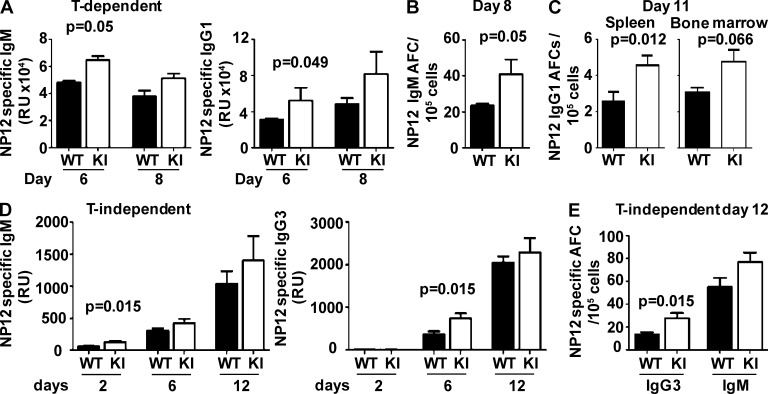
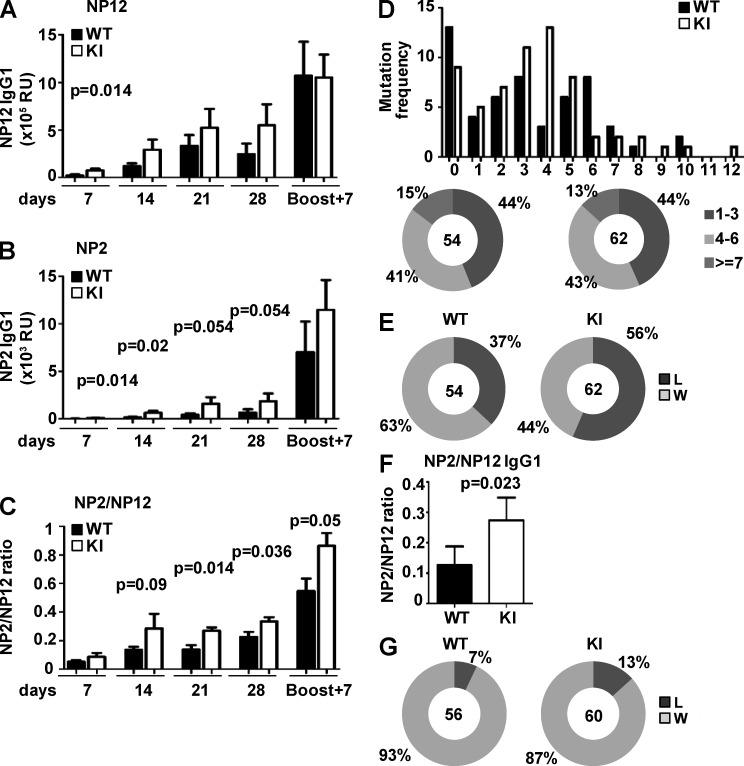
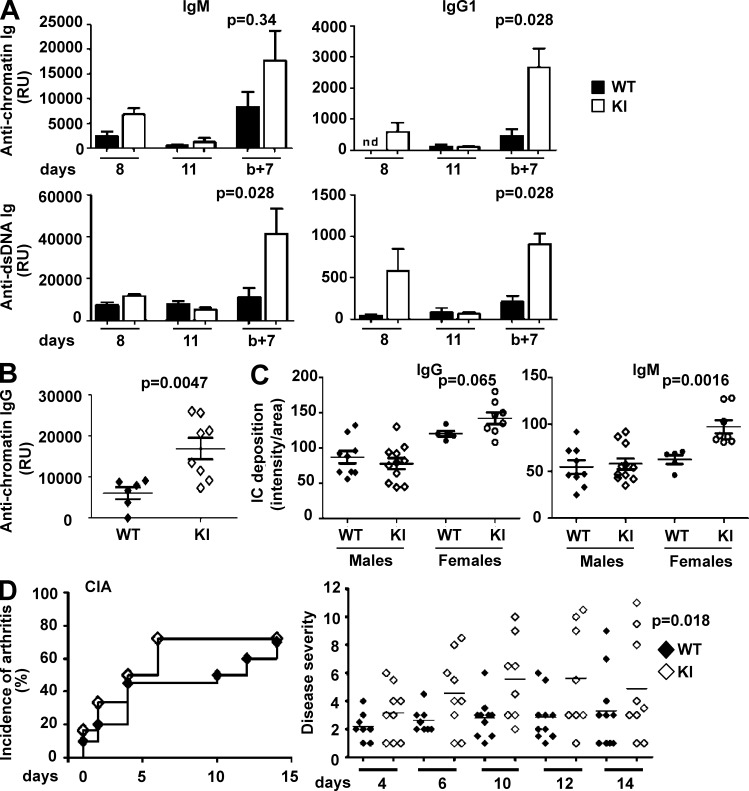
Genetic variants of the inhibitory Fc receptor FcγRIIb have been associated with systemic lupus erythematosus in humans and mice. The mechanism by which Fcgr2b variants contribute to the development of autoimmunity is unknown and was investigated by knocking in the most commonly conserved wild mouse Fcgr2b promoter haplotype, also associated with autoimmune-prone mouse strains, into the C57BL/6 background. We found that in the absence of an AP-1-binding site in its promoter, FcγRIIb failed to be up-regulated on activated and germinal center (GC) B cells. This resulted in enhanced GC responses, increased affinity maturation, and autoantibody production. Accordingly, in the absence of FcγRIIb activation-induced up-regulation, mice developed more severe collagen-induced arthritis and spontaneous glomerular immune complex deposition. Our data highlight how natural variation in Fcgr2b drives the development of autoimmune disease. They also show how the study of such variants using a knockin approach can provide insight into immune mechanisms not possible using conventional genetic manipulation, in this case demonstrating an unexpected critical role for the activation-induced up-regulation of FcγRIIb in controlling affinity maturation, autoantibody production, and autoimmunity.


Figures

Figure 1.
Figure 1.
Conservation of naturally occurring polymorphisms in Fcgr2b in congenic and wild mice. (A) Four deletions (X) have been identified within regulatory regions of the murine Fcgr2b gene, two in the promoter and two in intron 3. These deletions form three haplotypes in inbred strains of mice. The core promoters of Fcgr2b from the NZB (haplotype I), NZW (haplotype II), and C57BL/6 (haplotype III) strains were aligned using ClustalW. Polymorphisms present only in the NZW strain are highlighted in purple, those present only in the NZB strain in green, and those present in both NZB and NZW in yellow. A predicted AP-1–binding site is indicated by a red box. The asterisks below the sequences represent sequence identity. (B) Distribution of Fcgr2b polymorphisms within the inbred strain genealogy generated by Beck et al. (2000). (C) Fcgr2b haplotypes in wild mice. 53 DNA samples were obtained from wild mice from around the world, and the Fcgr2b haplotype was determined. Each circle represents a separate DNA sample.
Figure 2.
Figure 2.
Defective up-regulation of FcγRIIb expression on GC B cells in FcγRIIBwild/H1 KI mice. (A) Cloning strategy for the generation of the FcγRIIBwild/H1 KI mice. A PCR product corresponding to the promoter and three first exons from Fcgr2b from haplotype I (1,271 bp) was first fused with the 5′ homology arm (1,996 bp from haplotype III). The fusion product was then cloned into the targeting vector (pCR_LPacINeo; Ozgene). The 3′ homology arm (3,905 bp from haplotype III) was then amplified and cloned in the targeting vector. (B–G) Surface expression of FcγRIIb was assessed by flow cytometry 14 d after NP-KLH immunization on naive (PNAB220+) and GC B cells (PNA+B220+; B), memory B cells (IgG1+/PNACD38+; C), splenic PCs (CD138+B220lo; D), and BM PCs (CD138+B220lo; G). Surface FcγRIIb expression was also assessed by flow cytometry on unimmunized mice for splenic follicular B cells (CD21+CD23+), marginal zone B cells (CD21+CD23lo), and transitional B cells (CD21loCD23lo; E) and for BM pre-B cells (IgMB220+), immature B cells (IgM+B220+), and recirculating mature B cells (IgMhiB220+; F). (left) Representative dot plot of the gating strategy used to determine FcγRIIb expression on each subset. (middle) Representative overlay of FcγRIIb expression by FcγRIIbwild/H1 KI, WT, and FcγRIIb KO mice is shown for PNA+B220+ GC B cells. (right) Geometric mean fluorescence intensity (MFI) of FcγRIIb expression on the different cell subsets. (H) Splenocytes were stimulated with 20 µg/ml goat anti–mouse IgM F(ab′)2 or intact goat anti–mouse IgM for 72 h at 37°C. The expression of FcγRIIb on activated B cells was assessed by flow cytometry. The mean fluorescence intensity of FcγRIIb on activated B cells was plotted for WT and FcγRIIbwild/H1 KI mice. For all experiments, n ≥ 4 mice per group, and data are representative of at least three independent experiments. Error bars represent SEM, and p-values were determined using the Mann–Whitney two-tailed test with a risk of 5% (*, P < 0.05; **, P < 0.01).
Figure 3.
Figure 3.
The reduced transcriptional activity of the haplotype I Fcgr2b promoter is caused by three single nucleotide substitutions leading to defective AP-1 binding. (A) The transcriptional activity of the WT, KI, NZB, and NZW promoter of Fcgr2b was determined in the Bal17 B cell line stimulated with LPS for 48 h. WT versus: KI, P = 0.015; NZW, P = 0.037; and NZB, P = 0.034. (B) The transcriptional activity of the WT promoter mutated at the indicated positions was determined as in A. WT versus: KI/NZB, P = 0.02; WT GG−1/+2AA, P = 0.1; WT GG−1/+2AA/T−161C, P = 0.38; WT GG−1/+2AA/G−79C, P = 0.0025; WT GG−1/+2AA/C−59T, P = 0.88; WT GG−1/+2AA/A−19C, P = 0.5; and WT G−79C, P = 0.3. (C) The transcriptional activity of the KI/NZB promoter mutated at the indicated positions was determined as in A. WT versus: KI/NZB, P = 0.001; KI/NZB AA−1/+2GG/C−79G, P = 0.07; KI/NZB C−79G, P = 0.02; and KI/NZB AA−1/+2GG, P = 0.94. KI/NZB versus: KI/NZB AA−1/+2GG/C−79G, P = 0.03; KI/NZB C−79G, P = 0.06; and KI/NZB AA−1/+2GG, P = 0.001. (B and C) The dashed lines represent the luciferase activity of the Fcgr2b KI promoter. (D) Bal17 cells were stimulated for 24 h with anti-Ig or LPS before ChIP with anti–c-Fos or –c-Jun or an isotype control. The region of the Fcgr2b promoter encompassing position −79 was amplified by PCR from input and coimmunoprecipitated DNA. (E) WT and FcγRIIbwild/H1 KI splenic CD19+ B cells were stimulated for 8 h with anti-Ig or LPS and processed as in D. The region of the Fcgr2b promoter encompassing position −79 was amplified by SYBR green quantitative PCR, and the ΔCT of isotype and c-Fos or c-Jun was plotted for each condition. In all panels, error bars represent SEM, and p-values were determined using the Mann–Whitney two-tailed test with a risk of 5%.
Figure 4.
Figure 4.
Increased GC reaction in FcγRIIbwild/H1 KI mice. (A) 8 d after immunization with NP-KLH in alum, splenocytes were stimulated ex vivo, and the mean fluorescence intensity (MFI) of phospho-Syk and phospho-BLNK in GC B cells gated as B220+/GL7hiFAShi and naive B cells gated as B220+/GL7FAS was determined by flow cytometry. The ratio of naive and GC B cell mean fluorescence intensity is plotted. Data are representative of two or three independent experiments depending on the time points. n = 4 mice per group. (B) Splenic GC B cell numbers were determined by flow cytometry at day 8. Representative dot plots of WT and KI are shown. (C) GC formation in the spleen 8 d after immunization was assessed by immunohistology. Staining: anti-B220, B cell follicle; anti-CD8, T cell zone; and anti-KI67, GCs. Representative images of at least four mice per group are shown. Bars, 50 µm. (D and E) GC B cells (D) and NP-specific GC B cells (E) were enumerated at days 7, 8, 10, and 11 after immunization. n ≥ 4 mice, and data are representative of at least two experiments per time point. (F) 8 d after immunization, apoptosis and proliferation of GC B cells were assessed by staining apoptotic cells with CaspGLOW (left) and cells in cycle with anti-KI67 (right). n = 4 mice for the KI and 5 mice for the WT. Data are representative of at least two independent experiments. (G) The number of TFH cells (CD4+/CXCR5hiPD1hi) per spleen was determined 11 d after immunization with NP-KLH in alum. n = 6 for the WT and 5 for the KI. Data are representative of three independent experiments. In all panels, error bars represent SEM, and p-values were determined using the Mann–Whitney two-tailed test with a risk of 5%.
Figure 5.
Figure 5.
The early immune response is increased in FcγRIIbwild/H1 KI mice. (A) NP-specific IgM and IgG1 antibody serum titers were determined by ELISA 6 and 8 d after immunization with NP-KLH. (B) NP-specific IgM and IgG1 AFCs were enumerated by ELISPOT at day 8 in the spleen. Data are representative of at least two independent experiments. (C) NP-specific IgG1 AFCs were enumerated by ELISPOT at day 11 in the spleen and the BM. Two experiments have been pooled. (D) NP-specific IgM and IgG3 antibody serum titers were determined by ELISA 2, 6, and 12 d after immunization with NP-Ficoll. (E) Splenic NP-specific IgG3 and IgM AFCs were enumerated by ELISPOT 12 d after immunization. In all panels, error bars represent SEM, and p-values were determined using the Mann–Whitney two-tailed test with a risk of 5%. RU, relative units.
Figure 6.
Figure 6.
B cell–specific increased affinity maturation in FcγRIIbwild/H1 KI mice. (A and B) Total NP12-specific IgG1 antibody titer (A) and high-affinity NP2-specific IgG1 antibody titer (B) were determined by ELISA 7, 14, 21, and 28 d after immunization with NP-KLH and 7 d after secondary immunization (day 35). Concentrations are expressed in relative units (RU). (C) The ratio of high-affinity anti-NP2 and total anti-NP12 IgG1 titer at each time point was determined. n = 8 mice per group, and data are representative of at least two independent experiments. (D) VH mutation analysis of single cell sorted NP-specific GC B cells 11 d after immunization with NP-KLH (three pooled mice for each group). n = 54 sequences for the WT, and n = 62 sequences for the KI mice. Data are representative of three independent experiments. (E) The frequency of the high-affinity mutation W33L in VH186.2 CDR1 was assessed after nested PCR and sequencing. (F) WT and FcγRIIbwild/H1 KI µMT chimera mice were immunized with NP-KLH, and NP2/NP12 IgG1 ratio was determined by ELISA after 11 d. n = 12 mice for the WT, and n = 14 mice for the KI from three experiments pooled. (G) µMT chimera were immunized with NP-KLH, and GC B cells were sorted 11 d later from three pooled WT and three pooled KI chimera mice. The frequency of the high-affinity mutation W33L in VH186.2 CDR1 was assessed after nested PCR and sequencing of each clone. n = 56 sequences for the WT, and n = 60 sequences for the KI chimera mice. Data are representative of two independent experiments. In all panels, error bars represent SEM, and p-values were determined using the Mann–Whitney two-tailed test with a risk of 5%.
Figure 7.
Figure 7.
FcγRIIbwild/H1 KI mice demonstrate increased autoantibody production and are more susceptible to collagen-induced arthritis. (A) After immunization with NP-KLH, antichromatin (top) and anti-dsDNA (bottom) IgM and IgG1 titers were determined in WT and FcγRIIbwild/H1 KI mice at days 8 and 11 and 7 d after secondary immunization. n ≥ 4. Data are representative of at least two independent experiments. (B) Antichromatin IgG titer was determined in sex- and age-matched mice between 11 and 18 mo old. n = 6 mice for the WT, and n = 8 mice for the FcγRIIbwild/H1 KI. (C) IgG and IgM immune complex deposition in the kidney glomeruli of ageing mice was determined by immunohistofluorescence and quantified using Volocity. The relative intensity was normalized to the size of the glomeruli. The results obtained from two different ageing cohorts have been pooled. Mice were all between 14.5 and 15.5 mo old at time of sacrifice. (D) Representative incidence of arthritis after collagen injection (left). Disease severity in mice developing arthritis was scored from 1–3 per paw for a total of 1–12 per animal (right). Day 0 corresponds to the onset of disease. Data from three independent experiments were pooled. In all panels, error bars represent SEM, and p-values were determined using the Mann–Whitney two-tailed test with a risk of 5%, with the exception of D (right), in which the p-value was determined using the Kruskal–Wallis test. RU, relative units.

Comment in

References

    1. Alley T.L., Cooper M.D., Chen M., Kubagawa H. 1998. Genomic structure of PIR-B, the inhibitory member of the paired immunoglobulin-like receptor genes in mice. Tissue Antigens. 51:224–231 10.1111/j.1399-0039.1998.tb03096.x - DOI - PubMed
    1. Andersson K.B., Draves K.E., Magaletti D.M., Fujioka S., Holmes K.L., Law C.L., Clark E.A. 1996. Characterization of the expression and gene promoter of CD22 in murine B cells. Eur. J. Immunol. 26:3170–3178 10.1002/eji.1830261250 - DOI - PubMed
    1. Baerenwaldt A., Lux A., Danzer H., Spriewald B.M., Ullrich E., Heidkamp G., Dudziak D., Nimmerjahn F. 2011. Fcγ receptor IIB (FcγRIIB) maintains humoral tolerance in the human immune system in vivo. Proc. Natl. Acad. Sci. USA. 108:18772–18777 10.1073/pnas.1111810108 - DOI - PMC - PubMed
    1. Beck J.A., Lloyd S., Hafezparast M., Lennon-Pierce M., Eppig J.T., Festing M.F., Fisher E.M. 2000. Genealogies of mouse inbred strains. Nat. Genet. 24:23–25 10.1038/71641 - DOI - PubMed
    1. Blank M.C., Stefanescu R.N., Masuda E., Marti F., King P.D., Redecha P.B., Wurzburger R.J., Peterson M.G., Tanaka S., Pricop L. 2005. Decreased transcription of the human FCGR2B gene mediated by the -343 G/C promoter polymorphism and association with systemic lupus erythematosus. Hum. Genet. 117:220–227 10.1007/s00439-005-1302-3 - DOI - PubMed

Publication types

MeSH terms