. 2012 Nov 19;209(12):2263-76.
doi: 10.1084/jem.20121505. Epub 2012 Oct 29.

Conditional deletion of cytokine receptor chains reveals that IL-7 and IL-15 specify CD8 cytotoxic lineage fate in the thymus

Affiliations

Conditional deletion of cytokine receptor chains reveals that IL-7 and IL-15 specify CD8 cytotoxic lineage fate in the thymus

Tom M McCaughtry et al. J Exp Med. .

Abstract

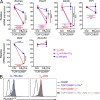
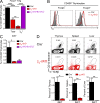
The thymus generates T cells with diverse specificities and functions. To assess the contribution of cytokine receptors to the differentiation of T cell subsets in the thymus, we constructed conditional knockout mice in which IL-7Rα or common cytokine receptor γ chain (γ(c)) genes were deleted in thymocytes just before positive selection. We found that γ(c) expression was required to signal the differentiation of MHC class I (MHC-I)-specific thymocytes into CD8(+) cytotoxic lineage T cells and into invariant natural killer T cells but did not signal the differentiation of MHC class II (MHC-II)-specific thymocytes into CD4(+) T cells, even into regulatory Foxp3(+)CD4(+) T cells which require γ(c) signals for survival. Importantly, IL-7 and IL-15 were identified as the cytokines responsible for CD8(+) cytotoxic T cell lineage specification in vivo. Additionally, we found that small numbers of aberrant CD8(+) T cells expressing Runx3d could arise without γ(c) signaling, but these cells were developmentally arrested before expressing cytotoxic lineage genes. Thus, γ(c)-transduced cytokine signals are required for cytotoxic lineage specification in the thymus and for inducing the differentiation of MHC-I-selected thymocytes into functionally mature T cells.


Figures
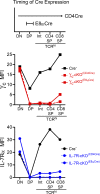
Figure 1.
Figure 1.
γc and IL-7Rα expression on thymocytes from wild-type and cKO mice. (Top) Schematic of CD4Cre and E8IIICre expression in developing thymocytes. Surface expression of γc (middle) and IL-7Rα (bottom) was determined on thymocytes from WT (Cre) or cKO (Cre+) mice using CD4Cre (colored dashed lines) or E8IIICre (colored solid lines). Total thymocytes were stained for CD4, CD8α, TCR-β, and γc or IL-7Rα and gated on the indicated thymocyte populations. MFI of γc and IL-7Rα staining are shown. Data are representative of four independent experiments.
Figure 2.
Figure 2.
Generation of γc-cKO mice. (A) Targeting strategy to generate γc-cKO allele. Numbered boxes = exons, gray boxes = out of frame exons as a result of Cre-mediated deletion. NeoR = neomycin resistance cassette. Black triangles = loxP sites. Gray ovals = frt sites. K, S = Kpn1 and Sac1 restriction sites, respectively. Locations of PCR primers are indicated with facing arrows. Location of 3′ probe for Southern blot is indicated. Configuration of the γc germline KO allele used in this study is shown for comparison. (B) PCR confirmation of proper integration of the 5′ end of construct in ES cells and genomic DNA from female knockin offspring. PCR amplification of a 2.9 Kb fragment flanking exon 1 and loxP integration site followed by Sac1 restriction digest reveals a 315 bp WT band and 365 bp targeted band as indicated in A. ES cells have only one targeted band because they are derived from male origin and thus have only one X chromosome. (C) Southern blot confirmation of proper integration of 3′ end of construct. Kpn1 restriction digest results in 9.2 Kb WT fragment and 3.2 Kb targeted fragment as depicted in A. (D) Confirmation that after Actin-flp recombinase-mediated deletion of the NeoR cassette, expression of the γcfl allele is equal to WT γc expression in the absence of Cre throughout T cell development.
Figure 3.
Figure 3.
Generation of IL-7Rα-cKO mice. (A) Targeting strategy to generate IL-7Rα-cKO allele. Numbered boxes = exons, gray boxes = out of frame exons as a result of Cre-mediated deletion. NeoR = neomycin resistance cassette. Black triangles = loxP sites. Gray ovals = frt sites. H, V = HindIII and EcoRV restriction sites, respectively. Location of 5′ and 3′ probes for Southern blot is indicated. Configuration of the IL-7Rα germline KO allele used in this study is shown for comparison sake. (B) Southern blot confirmation of proper integration of 5′ and 3′ ends of targeting construct in ES cells. HindIII restriction digest results in an 8 Kb WT fragment and a 4.7 Kb targeted fragment detected with the 5′ probe. EcoRV restriction digest results in a 14 kB WT fragment and a 11 kB targeted fragment detected with the 3′ probe as depicted in A. (C) Confirmation that after Actin-flp recombinase-mediated deletion of the NeoR cassette, expression of the IL-7Rαfl allele is equal to WT IL-7Rα expression in the absence of Cre throughout T cell development.
Figure 4.
Figure 4.
Impact on thymocyte development of targeted deletions of γc or IL-7Rα genes. (A) CD4 versus CD8α profiles of total thymus (left) and gated TCR-βhi thymocytes (right) from Cre control (black), γc-cKO (red), and IL-7Rα–cKO (blue) mice. FACS profiles for both CD4Cre and E8IIICre-mediated conditional deletion are shown. Numbers indicate frequencies of cells in gates. Data are representative of four independent experiments. (B, Top) Absolute thymocyte numbers for DP, TCR-βhi Int, TCR-βhi CD4SP, and TCR-βhi CD8SP populations are shown for γc-cKO (red) compared with Cre control mice (black). Cell numbers for both CD4Cre and E8IIICre mice are shown. (B, Bottom) Absolute thymocyte numbers for DP, TCR-βhi Int, TCR-βhi CD4SP, and TCR-βhi CD8SP populations are shown for IL-7Rα–cKO (blue) compared with Cre control mice (black). Cell numbers for both CD4Cre and E8IIICre mice are shown. Cell numbers were calculated by gating specifically on cells that had deleted γc or IL-7Rα. Data represent the mean of 4–13 individual male and female mice aged 5–9 wk from at least four independent experiments. Error bars represent SEM, and all statistically significant changes are marked with asterisks: **, P < 0.01; ****, P < 0.0001. Any comparisons not marked with asterisks were not significant (P > 0.05). (C, Left) Frequency of MHC-II–selected TCR-βhi CD4SP thymocytes from β2m−/− γc-cKO mice (red) compared with Cre control mice (black). γc-cKO-derived cells were specifically gated for those that were γc-deleted. Data are depicted as frequencies of total thymus on the left y-axis and relative frequencies normalized to Cre control on the right y-axis of the histogram plot. Data for E8IIICre mice are shown. (C, Right) Frequency of TCR-βhi CD8SP thymocytes from γc-cKO mice (red), IL-7Rα–cKO mice (blue), and Cre control mice (black) are shown. γc-cKO and IL-7 Rα-cKO-derived cells were specifically gated for those that were γc- or IL-7Rα–deleted. Data are depicted as frequencies of total thymus on the left y-axis and relative frequencies normalized to Cre control on the right y-axis of the histogram plot. Data for E8IIICre mice are shown. Means of at least three individual mice are shown, and error bars represent SEM. *, P < 0.05; n.s., not significant. (D) Expression of Qa-2 and HSA on TCR-βhi CD4SP thymocytes from γc-cKO mice (red; specifically gated on γc-deleted cells) and Cre control mice (black). Shaded histograms represent negative staining control. Data are representative of five independent experiments. (E) Frequency of donor-derived thymocytes from mixed bone marrow chimeras. Mixed bone marrow chimeras were made by reconstituting lethally irradiated mice with a 1:1 mixture of T cell–depleted bone marrow from wild-type and γc-cKO mice. After 8 wk, mice were analyzed for the composition of donor-derived cells within the indicated thymocyte subset using congenic markers to discriminate cells derived from each donor. γc-cKO–derived cells were specifically gated for those that were γc-deleted. The dashed horizontal line indicates the expected frequency of cells derived from each donor. Means of five individual mice are shown, and error bars represent SEM. ***, P = 0.0001.
Figure 5.
Figure 5.
Analysis of CD8 lineage gene expression. (A) Relative mRNA expression of the indicated genes. TCR-βhi CD8SP thymocytes were sorted from Cre control mice and TCR-βhi CD8SP thymocytes gated specifically on IL-7Rα–deleted (blue circles) or γc-deleted (red squares and purple diamonds) were sorted from E8IIICre cKO mice. RNA was isolated and expression of the indicated genes was analyzed by real-time PCR. Purple diamonds indicate γc-cKO mice with transgenic expression of Bcl-2. Data are normalized to Rpl13A and Cre controls. Means of at least three individual mice are shown, and error bars represent SEM. *, P < 0.05; **, P < 0.01; ***, P < 0.001; ****, P < 0.0001. (B) Runx3dYFP reporter expression in IL-7Rα–deleted and γc-deleted cells. Total thymocytes from IL-7Rα–cKO Runx3dYFP/wt (left) and γc-cKO Runx3d YFP/wt (right) were stained for CD4, CD8α, TCR-β and IL-7Rα or γc expression. Runx3dYFP reporter expression is compared between TCR-βhi CD4SP cells (black line) and TCR-βhi CD8SP gated on IL-7Rα-deleted (blue line) and IL-7Rα–positive cells (escapees, gray shaded; left), and TCR-βhi CD8SP gated on γc-deleted (red line) and γc-positive cells (escapees, gray shaded; right). Data are representative of three independent experiments.
Figure 6.
Figure 6.
Contribution of IL-15 to generation of CD8 lineage cells. (A) Thymocyte profiles resulting from E8IIICre-mediated deletion of IL-7Rα alone or in combination with IL-4Rα or IL-15 germline deficiency. Total thymocytes were analyzed for expression of CD8α, CD4, and TCR-β from Cre control (black), germline IL-15−/− (olive green), E8IIICre IL-7R–cKO (blue), IL-7R–cKO combined with germline IL-4R−/− (brown) or IL-15−/− (bright green) mice. Data are representative of at least three independent experiments. (B) Total thymocyte number and frequency of TCR-βhi CD8SP thymocytes from mice in A shown in comparison to γc-cKO mice (red). γc-cKO– and IL-7Rα–cKO-derived cells were specifically gated for those that were γc- or IL-7Rα–deleted. Data represent the means after pooling at least six individual mice from at least three independent experiments. (C) Relative frequency of TCR-βhi CD8SP thymocytes after E8IIICre-mediated deletion of IL-7Rα alone (blue line) or in combination with germline deletion of IL-4Rα (brown line) or IL-15 (green line). IL-7Rα–deleted TCR-βhi CD8SP thymocyte frequencies were analyzed from total thymocytes. Data are shown as frequencies normalized to Cre controls. Data represent the mean after pooling at least eight individual mice from at least two independent experiments. (D) Relative frequency of IL-7Rα–deleted TCR-βhi CD8SP thymocytes resulting from deletion of IL-7Rα alone (blue line) or in combination with IL-15 (green line) compared with frequency of γc-deleted TCR-βhi CD8SP thymocytes from γc-cKO mice (red line). Data were obtained as for Fig. 6 C. Data represent the mean of at least six individual mice from at least three independent experiments. (B–D) Error bars represent SEM. All statistically significant changes are marked with asterisks: *, P < 0.05; **, P < 0.01; ***, P < 0.001; ****, P < 0.0001. Any comparisons not marked with asterisks were not significant.
Figure 7.
Figure 7.
IL-15 is required for induction of cytotoxic lineage genes in IL-7Rα–cKO thymocytes. (A) Relative mRNA expression of the indicated genes. IL-7Rα–cKO and γc-cKO data from Fig. 5 A are shown compared with TCR-βhi CD8SP thymocytes sorted from IL-7Rα–cKO–IL-15−/− mice by gating specifically for IL-7Rα–deleted thymocytes. Data are normalized to Rpl13A and Cre controls. Means of at least three mice are shown, and error bars represent SEM. All statistically significant changes are marked with asterisks: **, P < 0.01; ***, P < 0.001; ****, P < 0.0001. Any comparisons not marked with asterisks were not significant. (B) Expression of CD122 and CD44 on IL-7Rα–deleted TCR-βhi CD8SP thymocytes from IL-7Rα–cKO (blue line) and IL-7Rα–cKO–IL-15−/− (olive green line) mice compared with WT (shaded histograms). Dotted line represents negative staining control. Data are representative of three independent experiments.
Figure 8.
Figure 8.
Analysis of peripheral CD8 T cells from IL-7Rα–cKO and γc-cKO mice. (A) Absolute cell number of splenic CD8+ T cells. CD8+ T cell numbers were determined from splenocytes for Cre control (black bar), IL-7Rα–cKO (blue bar), and IL-7Rα–cKO–IL-15−/− (green bar) mice. CD8+ T cells from IL-7Rα–cKO and IL-7Rα–cKO–IL-15−/− mice were specifically gated on IL-7Rα–deleted cells. Data represent the mean of at least seven individual mice from at least four independent experiments, and error bars represent SEM. ****, P < 0.0001. (B) TCR-β+ CD8+ splenocytes were analyzed for frequency of naive and CD44hiCD122hi memory phenotype cells among IL-7Rα–deleted cells (blue) compared with Cre controls (black). Data are representative of three independent experiments. (C) Absolute CD8+ T cell numbers were determined from splenocytes from Cre control (black bar), and γc-cKO (red bars) mice. CD8+ T cells from γc-cKO mice were specifically gated on γc-undeleted (labeled γc+) or γc-deleted (labeled γcΔ) cells. Data represent the mean of at least seven individual mice from at least three independent experiments, and error bars indicate SEM. ***, P < 0.001; ****, P < 0.0001. (D) TCR-β+ CD8+ splenocytes were analyzed for frequency of naive and CD44hiCD122hi memory phenotype cells among γc+ (escapees) cells from γc-cKO mice (red) compared with Cre controls (black). Data are representative of three independent experiments.
Figure 9.
Figure 9.
Impact of γc deletion on CD4+ regulatory T cells and iNKT cells. (A) TCR-βhi CD4SP thymocytes were analyzed for Foxp3+ cells from Cre control mice (black bar) and for γc-deleted Foxp3+ cells from γc-cKO (red bars) and γc-cKO-Bcl2 transgenic (purple bar) mice. Total Foxp3+ CD4SP thymocytes from γc-cKO mice are shown (plain red) or after specifically gating on γc-deleted Foxp3+ CD4SP thymocytes (red with black). Frequencies of Foxp3+ cells among CD4SP cells are shown. Means of at least three mice are shown, and error bars represent SEM. **, P < 0.01; ****, P < 0.0001. (B) γc expression on Foxp3 (non–T reg cells) and Foxp3+ CD4SP thymocytes. CD4SP thymocytes were gated on Foxp3 and Foxp3+ subsets and analyzed for expression of γc from γc-cKO (red) compared with Cre control (black) mice. Gray histograms represent negative staining controls. Data are representative of at least three individual mice. (C) CD4SP thymocytes were analyzed for TCR-β+ CD1d-tetramer+ iNKT cells from Cre control (black bar), γc-cKO (red bar), and γc-cKO-Bcl2 transgenic (purple bar) mice. Frequencies of iNKT cells among CD4SP cells are shown. Means of at least three mice are shown, and error bars indicate SEM. *, P < 0.05. (D, Top) The frequency of iNKT cells in various tissues. Total thymocytes, splenocytes, or lymphocytes prepared from the liver of γc-cKO (red) or Cre control (black) mice were analyzed for expression of TCR-β and binding of CD1d-tetramer. Data are representative of at least three individual mice. (D, Bottom) Quantitation of pooled data from Cre control (black) or γc-cKO (red) mice. Means of at least three mice are shown, and error bars indicate SEM. *, P < 0.05; **, P < 0.01.

Similar articles

Cited by

References

    1. Adoro S., McCaughtry T., Erman B., Alag A., Van Laethem F., Park J.H., Tai X., Kimura M., Wang L., Grinberg A., et al. 2012. Coreceptor gene imprinting governs thymocyte lineage fate. EMBO J. 31:366–377 10.1038/emboj.2011.388 - DOI - PMC - PubMed
    1. Al-Shami A., Spolski R., Kelly J., Fry T., Schwartzberg P.L., Pandey A., Mackall C.L., Leonard W.J. 2004. A role for thymic stromal lymphopoietin in CD4+ T cell development. J. Exp. Med. 200:159–168 10.1084/jem.20031975 - DOI - PMC - PubMed
    1. Bosselut R., Guinter T.I., Sharrow S.O., Singer A. 2003. Unraveling a revealing paradox: Why major histocompatibility complex I-signaled thymocytes “paradoxically” appear as CD4+8lo transitional cells during positive selection of CD8+ T cells. J. Exp. Med. 197:1709–1719 10.1084/jem.20030170 - DOI - PMC - PubMed
    1. Brugnera E., Bhandoola A., Cibotti R., Yu Q., Guinter T.I., Yamashita Y., Sharrow S.O., Singer A. 2000. Coreceptor reversal in the thymus: signaled CD4+8+ thymocytes initially terminate CD8 transcription even when differentiating into CD8+ T cells. Immunity. 13:59–71 10.1016/S1074-7613(00)00008-X - DOI - PubMed
    1. Burchill M.A., Yang J., Vogtenhuber C., Blazar B.R., Farrar M.A. 2007. IL-2 receptor beta-dependent STAT5 activation is required for the development of Foxp3+ regulatory T cells. J. Immunol. 178:280–290 - PubMed

Publication types

MeSH terms