

High mitochondrial DNA copy number and bioenergetic function are associated with tumor invasion of esophageal squamous cell carcinoma cell lines
- PMID: 23109849
- PMCID: PMC3472741
- DOI: 10.3390/ijms130911228
High mitochondrial DNA copy number and bioenergetic function are associated with tumor invasion of esophageal squamous cell carcinoma cell lines
Abstract
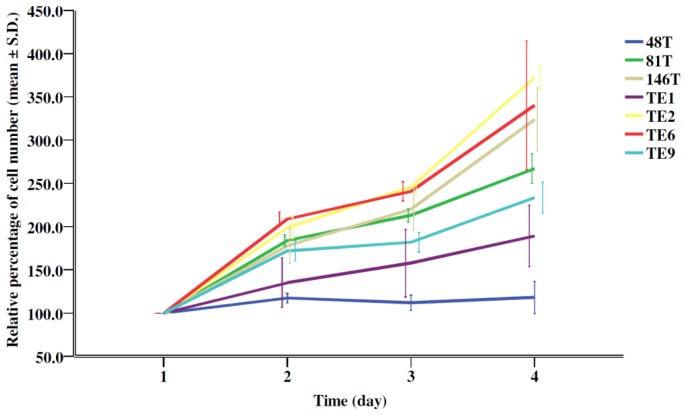
We previously reported a gradual increase of relative mitochondrial DNA (mtDNA) copy number during the progression of esophageal squamous cell carcinoma (ESCC). Because mitochondria are the intracellular organelles responsible for ATP production, we investigated the associations among mtDNA copy number, mitochondrial bioenergetic function, tumor invasion and the expression levels of epithelial mesenchymal transition (EMT) markers in a series of seven ESCC cell lines, including 48T, 81T, 146T, TE1, TE2, TE6 and TE9. Among them, TE1 had the highest relative mtDNA copy number of 240.7%. The mRNA of mtDNA-encoded ND1 gene (2.80), succinate-supported oxygen consumption rate (11.21 nmol/min/10(6) cells), ATP content (10.7 fmol/cell), and the protein level of mitochondrial transcription factor A (TFAM) were the highest and the lactate concentration in the culture medium (3.34 mM) was the lowest in TE1. These findings indicate that TE1 exhibited the highest bioenergetic function of mitochondria. Furthermore, TE1 showed the highest trans-well migration activity of 223.0 cells/field, the highest vimentin but the lowest E-cadherin protein expression levels, which suggest that TE1 had the highest invasion capability. We then conducted a knockdown study using pLKO.1-based lentiviral particles to infect TE1 cells to suppress the expression of TFAM. Molecular analyses of the parental TE1, control TE1-NT and TFAM knockdown TE1-sh-TFAM(97) cells were performed. Interestingly, as compared to the control TE1-NT, TE1-sh-TFAM(97) exhibited lower levels of the relative mtDNA copy number (p = 0.001), mRNA of mtDNA-encoded ND1 gene (p = 0.050), succinate-supported oxygen consumption rate (p = 0.065), and ATP content (p = 0.007), but had a higher lactate concentration in the culture medium (p = 0.010) and higher protein level of lactate dehydrogenase. A decline in mitochondrial bioenergetic function was observed in TE1-sh-TFAM(97). Significantly, compared to the control TE1-NT, TE1-sh-TFAM(97) had a lower trans-well migration activity (p < 0.001), a higher E-cadherin level but a lower vimentin protein level, which indicates a decrease of invasiveness. Taken together, we suggest that high relative mtDNA copy number and bioenergetic function of mitochondria may confer an advantage for tumor invasion of ESCC.
Keywords: bioenergetic function; epithelial mesenchymal transition (EMT); esophageal squamous cell carcinoma (ESCC); invasion; mitochondrial DNA (mtDNA).
Figures


Similar articles
-
Role of mitochondrial function in the invasiveness of human colon cancer cells.Oncol Rep. 2018 Jan;39(1):316-330. doi: 10.3892/or.2017.6087. Epub 2017 Nov 9. Oncol Rep. 2018. PMID: 29138850
-
Role of Mitochondrial DNA Copy Number Alteration in Human Renal Cell Carcinoma.Int J Mol Sci. 2016 May 25;17(6):814. doi: 10.3390/ijms17060814. Int J Mol Sci. 2016. PMID: 27231905 Free PMC article.
-
Low mitochondrial DNA copy number induces chemotherapy resistance via epithelial-mesenchymal transition by DNA methylation in esophageal squamous cancer cells.J Transl Med. 2022 Aug 29;20(1):383. doi: 10.1186/s12967-022-03594-2. J Transl Med. 2022. PMID: 36038893 Free PMC article.
-
Mitochondrial transcription factor A regulates mitochondrial transcription initiation, DNA packaging, and genome copy number.Biochim Biophys Acta. 2012 Sep-Oct;1819(9-10):921-9. doi: 10.1016/j.bbagrm.2012.03.002. Epub 2012 Mar 21. Biochim Biophys Acta. 2012. PMID: 22465614 Review.
-
The Protective Mechanism of TFAM on Mitochondrial DNA and its Role in Neurodegenerative Diseases.Mol Neurobiol. 2024 Jul;61(7):4381-4390. doi: 10.1007/s12035-023-03841-7. Epub 2023 Dec 12. Mol Neurobiol. 2024. PMID: 38087167 Review.
Cited by
-
Rethinking the biology of metastatic melanoma: a holistic approach.Cancer Metastasis Rev. 2021 Jun;40(2):603-624. doi: 10.1007/s10555-021-09960-8. Epub 2021 Apr 19. Cancer Metastasis Rev. 2021. PMID: 33870460 Free PMC article. Review.
-
Metabolic Reprogramming in Response to Alterations of Mitochondrial DNA and Mitochondrial Dysfunction in Gastric Adenocarcinoma.Int J Mol Sci. 2022 Feb 6;23(3):1857. doi: 10.3390/ijms23031857. Int J Mol Sci. 2022. PMID: 35163779 Free PMC article.
-
The SNPs of mitochondrial DNA displacement loop region and mitochondrial DNA copy number associated with risk of polymyositis and dermatomyositis.Sci Rep. 2022 Apr 7;12(1):5903. doi: 10.1038/s41598-022-09943-x. Sci Rep. 2022. PMID: 35393495 Free PMC article.
-
Esophageal squamous cell carcinoma with low mitochondrial copy number has mesenchymal and stem-like characteristics, and contributes to poor prognosis.PLoS One. 2018 Feb 15;13(2):e0193159. doi: 10.1371/journal.pone.0193159. eCollection 2018. PLoS One. 2018. PMID: 29447301 Free PMC article.
-
Elucidating the Metabolic Plasticity of Cancer: Mitochondrial Reprogramming and Hybrid Metabolic States.Cells. 2018 Mar 13;7(3):21. doi: 10.3390/cells7030021. Cells. 2018. PMID: 29534029 Free PMC article. Review.
References
-
- Li J.Y., Liu B.Q., Li G.Y., Chen Z.J., Sun X.I., Rong S.D. Atlas of cancer mortality in the People’s Republic of China. An aid for cancer control and research. Int. J. Epidemiol. 1981;10:127–133. - PubMed
-
- Li J.Y. Cancer mapping as an epidemiologic research resource in China. Recent Results Cancer Res. 1989;114:115–136. - PubMed
-
- Law S., Wong J. Esophageal cancer surgery: Lessons from 1200 resections. Hawaii Med. J. 2004;63:203–205. - PubMed
-
- Wu I.C., Lu C.Y., Kuo F.C., Tsai S.M., Lee K.W., Kuo W.R., Cheng Y.J., Kao E.L., Yang M.S., Ko Y.C. Interaction between cigarette, alcohol and betel nut use on esophageal cancer risk in Taiwan. Eur. J. Clin. Invest. 2006;36:236–241. - PubMed
-
- Lin C.S., Chang S.C., Wei Y.H., Chou T.Y., Wu Y.C., Lin H.C., Wang L.S., Hsu W.H. Prognostic variables in thoracic esophageal squamous cell carcinoma. Ann. Thorac. Surg. 2009;87:1056–1065. - PubMed
Publication types
MeSH terms
Substances
LinkOut - more resources
Full Text Sources
Medical
Research Materials
