. 2012;7(10):e45606.
doi: 10.1371/journal.pone.0045606. Epub 2012 Oct 22.

Silencing of miR-370 in human cholangiocarcinoma by allelic loss and interleukin-6 induced maternal to paternal epigenotype switch

Affiliations

Silencing of miR-370 in human cholangiocarcinoma by allelic loss and interleukin-6 induced maternal to paternal epigenotype switch

Fangmei An et al. PLoS One. 2012.

Abstract

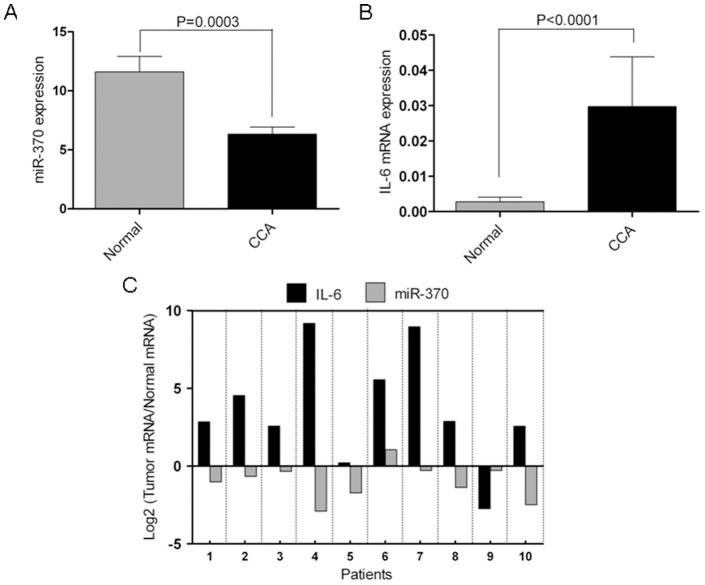
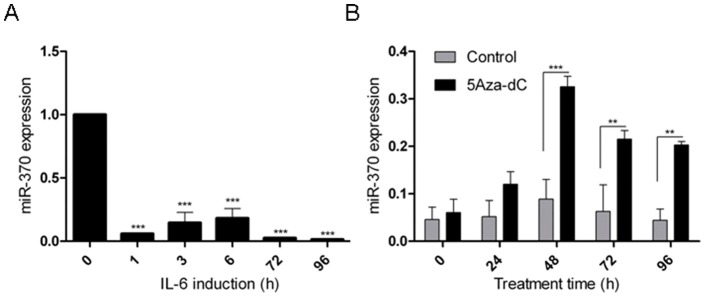
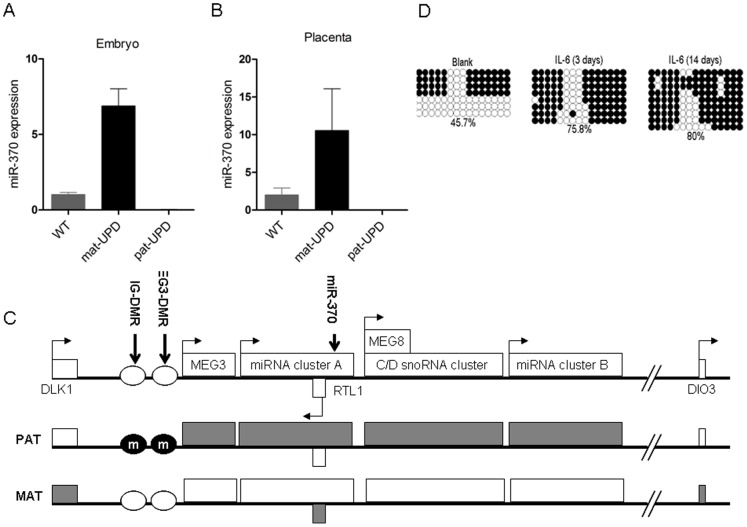
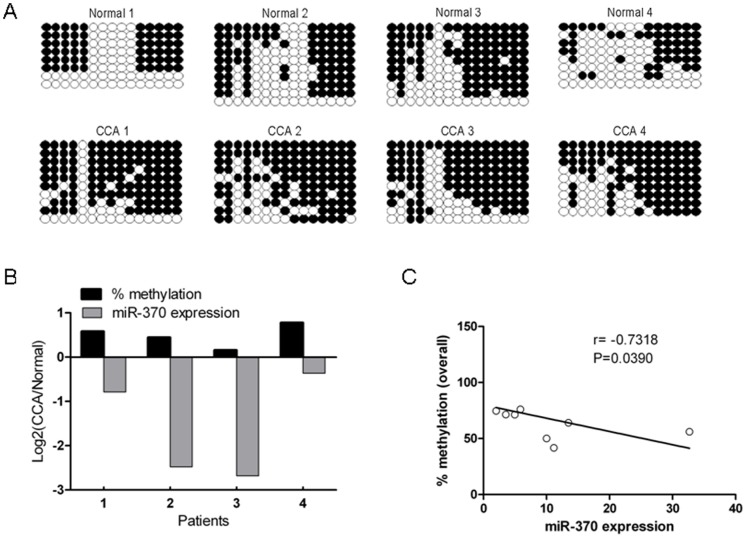
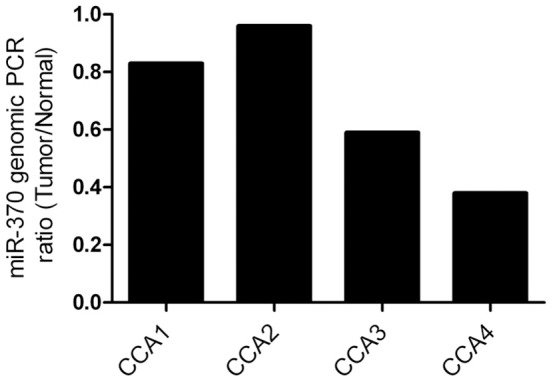
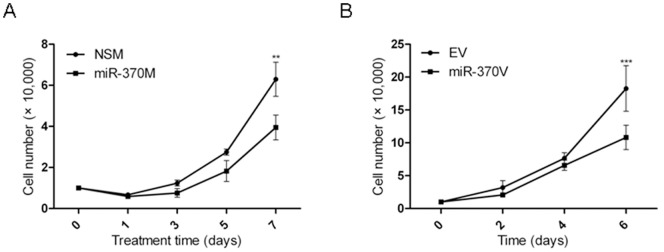
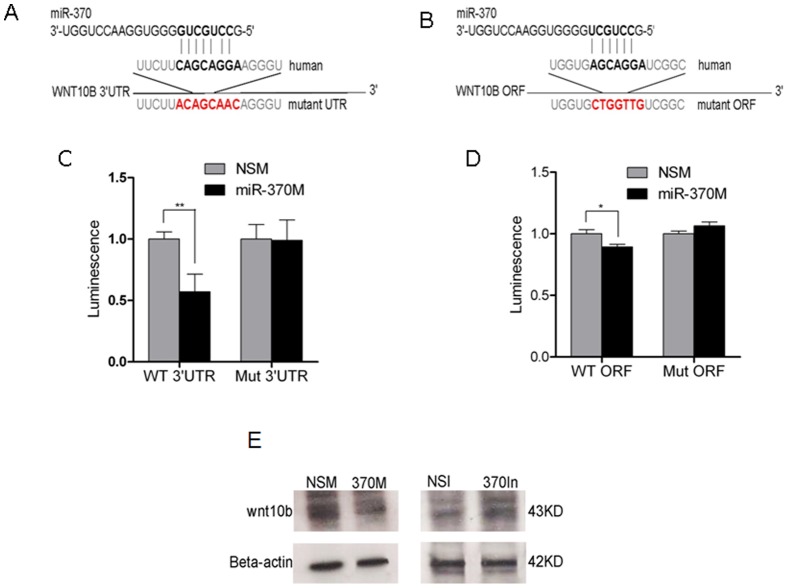
Cholangiocarcinoma (CCA) is a highly lethal malignant tumor arising from the biliary tract epithelium. Interleukin-6 (IL-6) is a major mediator of inflammation and contributor to carcinogenesis within the biliary tree. Previous studies suggested that enforced IL-6 contributes to cholangiocarcinogenesis through hypermethylation of several genes implicated in CCA. However, the precise mechanisms of IL-6 effects in CCA remain unclear. We now demonstrate that microRNA (miR)-370 is underexpressed in a large cohort of human CCA vs. normal liver tissues. In addition, we show that IL-6 induces a time-dependent silencing of miR-370. In addition, demethylation of CCA cells results in upregulation of miR-370. Furthermore, we demonstrate that miR-370 is imprinted, and that the Intergenic Differentially Methylated Region (IG-DMR) responsible for imprinting regulation of this genomic locus is hypermethylated in response to IL-6 treatment. In addition, the IG-DMR is hypermethylated in human CCA specimens compared to normal matched controls, in the same location as the IL-6 induced hypermethylation. Finally, miR-370 was found to regulate WNT10B in luciferase as well as western blotting experiments. Our data indicate that the paternal allele of miR-370 is normally silenced through genomic imprinting and that the overexpression of IL-6 in CCA effectively suppresses the expression of miR-370 from the maternal allele, lending support to the theory that miR-370 silencing in human CCA follows a classic two-hit mechanism.


Conflict of interest statement

Competing Interests: The authors have declared that no competing interests exist.

Figures

Figure 1
Figure 1. miR-370 and IL-6 are inversely correlated in human CCA. A. miR-370 is downregulated in human CCA vs. normal liver tissues.
The figure displays the mean and standard deviation of qRT-PCR-measured expression of miR-370 normalized to RNU6B for human CCA and normal liver tissues. B. IL-6 is upregulated in human CCA vs. normal liver tissues. The figure displays the mean and standard deviation of qRT-PCR-measured expression of IL-6 mRNA normalized to β-actin for human CCA and normal liver tissues. C. miR-370 and IL-6 display an inverse relationship in matched human CCA and normal specimens. Ten pairs of CCA and matched normal liver tissues for which we had expression data for both miR-370 and IL-6 were analyzed. For each CCA specimen, we compared the level of miR-370 and IL-6, respectively, to their corresponding normal specimen. The figure displays the Log2 of the ratio of miR-370 in CCA vs. matched normal as well as the Log2 of the ratio of IL-6 in CCA vs. matched normal specimen. Since the data is displayed in log space, a positive value on the Y-axis for miR-370 or IL-6 represents overexpression of miR-370 or IL-6, respectively, in a CCA specimen vs. matched normal specimen. Conversely, a negative value on the Y-axis represents underexpression of miR-370 or IL-6, respectively, in the CCA specimen vs. matched normal specimen. The X-axis displays the 10 pairs of CCA and matched normal specimens.
Figure 2
Figure 2. IL-6 and promoter methylation modulate expression of miR-370. A. IL-6 reduces miR-370 expression in HuCCT1 cells.
X-axis – duration of IL-6 treatment (in hours). Y-axis – Mean and standard deviation of qRT-PCR-measured expression of miR-370 normalized to RNU6B. B. Treatment with the demethylating agent 5Aza-dC upregulates miR-370 expression in HuCCT1 cells. Black column - 5Aza-dC-treated cells, gray column – negative control. X-axis –the duration of 5 Aza-dC treatment (hours). Y-axis – Mean and standard deviation of qRT-PCR-measured expression of miR-370 normalized to RNU6B. Data represents the mean value of three independent experiments, **P<0.01, ***P<0.001.
Figure 3
Figure 3. miR-370 is normally imprinted.
A and B. Maternal, but not paternal, UPD(12) disomy mice express miR-370. To establish the imprinting status of miR-370, TaqMan qPCR was carried out on wild-type mice and mice with maternal and paternal uniparental disomy for chromosome 12 (WT, mat-UPD and pat-UPD respectively). miR-370 expression is strongly elevated in mat-UPD embryos and is absent from pat-UPD embryos, showing that miR-370 is a maternally expressed imprinted gene. Mean ± SD, *P<0.05, **P<0.01. C. miR-370 is located within the DLK-DIO3 domain. The genomic map of imprinted DLK-DIO3 control domain is displayed: gray rectangles indicate silenced alleles and the blank rectangles indicate expressed alleles, the paternally (PAT) expressed alleles are DLK1, RTL1 and DIO3. The maternally (MAT) expressed non-coding RNA genes include maternally expressed gene 3 (MEG3), anti-RTL1 (encodes the smaller miR cluster A), maternally expressed gene 8 (MEG8) (encodes small nucleolar RNA (snoRNA) cluster) and the larger miR cluster. IG-DMR and MEG3-DMR are methylated on the paternal chromosome indicated by the encircled letter m. miR-370 is a member of the cluster A of miRs and located within the DLK1-DIO3 domain. D. IL-6 induces gain of methylation at IG-DMR-CG6 in HuCCT1 cells. Each line indicates a single clone (either of maternal, or paternal origin), and each circle denotes the cytosine of a CpG site; filled and open circles represent methylated and unmethylated cytosines, respectively. The number at the bottom indicates the percentage of methylated cytosines.
Figure 4
Figure 4. Methylation of IG-DMR-CG6 influences miR-370 expression.
A. IG-DMR-CG6 is hypermethylated in human CCAs vs. matched normal tissues. Each line indicates a single clone, and each circle denotes the cytosine of a CpG site; filled and open circles represent methylated and unmethylated cytosines, respectively. B. miR-370 expression is inversely related to methylation at IG-DMR-CG6 in human liver specimens. X-axis - methylation rate, and miR-370 expression, Y-axis - human tissues. Percent methylation and miR-370 expression are expressed as a log2 of the ratio between the cancer and matched normal specimen. Since the data is expressed in logarithmic space, a positive value (as in the values for methylation for all 4 specimens) signifies more methylation in cancer vs. matched normal tissue. A negative value (as in the values for miR-370 for all 4 specimens) signifies a lower expression in cancer vs. matched normal specimen. These data demonstrates that for all 4 pairs of specimens, an increased in the methylation at IG-DMR-CG6 in cancer vs. matched normal is accompanied by a lower level of miR-370 in cancer vs. matched normal specimen. C. The expression of miR-370 is inversely correlated with level of DNA methylation. X-axis- miR-370 expression, Y-axis- overall methylation rate (%). r-correlation coefficient, p- P value.
Figure 5
Figure 5. Two of the four CCA tissues displayed LOH at miR-370 locus vs. matched normal tissues.
For each CCA specimen, we calculated the ratio between the level of miR-370 DNA in cancer vs. matched normal specimen. This ratio is displayed on the Y-axis. A ratio close to 1 (as shown for CCA1 and CCA2) signifies no LOH while a ratio close to 0.5 (as in CCA3 and CCA4) suggests LOH at miR-370 in CCA vs. matched normal tissue.
Figure 6
Figure 6. miR-370 induces growth retardation.
A. HuCCT1 malignant cholangiocytes display decreased growth upon reinforcement of miR-370 expression. X-axis – HuCCT1 cells counted at day 1, 3, 5 and 7 after transfection with miR-370M, or NSM, respectively. Y-axis – cell counts ×104 of HuCCT1 cells transfected with miR-370 mimic (miR-370M, black squares) or NSM (black circles). B. HuCCT1 malignant cholangiocytes display decreased growth upon modest miR-370 upregulation through infection with MIEG3-miR-370. X-axis – HuCCT1 cells counted at days 2, 4 and 6 after plating of MIEG3-miR-370 (miR-370V) HuCCT1 cells or MIEG3-EV (EV) HuCCT1 cells, respectively. Y-axis – cell counts ×104 of miR-370V HuCCT1 cells (black circles) or the EV HuCCT1 cells (black squares). For every treatment and every time point, the data presented is the average of 5 independently counted wells. Mean ± SD, **P<0.01, ***P<0.001.
Figure 7
Figure 7. miR-370 modulates the expression of WNT10B.
A and B. WNT10B is a putative target of miR-370. The seed of miR-370 displays complementarity to position 668–674 of WNT10B 3′UTR (A) as well as to position 458–464 of WNT10B ORF (B) in bold. Mutated nucleotides are shown in red. C and D. miR-370 binds directly to WNT10B. PGL4 luciferase reporter plasmids containing wild-type WNT10B 3′UTR (C) or open reading frame (ORF) (D) were cotransfected with miR-370 mimic (miR-370M) or non-specific mimic (NSM), respectively. The PGL4 plasmids containing mutant target site of the WNT10B 3′UTR or ORF were also cotransfected with miR-370M or NSM. The firefly luciferase activity was normalized to the Renilla luciferase activity for each sample. Data represents the mean value of three independent experiments. Mean ± SD. *P<0.05, **P<0.01. E. WNT10B protein changes upon miR-370 manipulation. Equal protein loading was performed, as shown by β-actin. NSM – non-specifici mimic; miR-370M – miR-370 mimic; NSI – non specific inhibitor; miR-370In – miR-370 inhibitor.

References

    1. Blechacz B, Gores GJ (2008) Cholangiocarcinoma: advances in pathogenesis, diagnosis, and treatment. Hepatology 48: 308–321. - PMC - PubMed
    1. Zografos GN, Farfaras A, Zagouri F, Chrysikos D, Karaliotas K (2011) Cholangiocarcinoma: principles and current trends. Hepatobiliary Pancreat Dis Int 10: 10–20. - PubMed
    1. Meng F, Yamagiwa Y, Ueno Y, Patel T (2006) Over-expression of interleukin-6 enhances cell survival and transformed cell growth in human malignant cholangiocytes. J Hepatol 44: 1055–1065. - PMC - PubMed
    1. Boumber Y, Issa JP (2011) Epigenetics in cancer: what's the future? Oncology (Williston Park) 25: 220–226, 228. - PubMed
    1. Isomoto H (2009) Epigenetic alterations associated with cholangiocarcinoma (review). Oncol Rep 22: 227–232. - PubMed

Publication types