. 2012;7(10):e47502.
doi: 10.1371/journal.pone.0047502. Epub 2012 Oct 26.

Smooth pursuit and visual occlusion: active inference and oculomotor control in schizophrenia

Affiliations

Smooth pursuit and visual occlusion: active inference and oculomotor control in schizophrenia

Rick A Adams et al. PLoS One. 2012.

Abstract

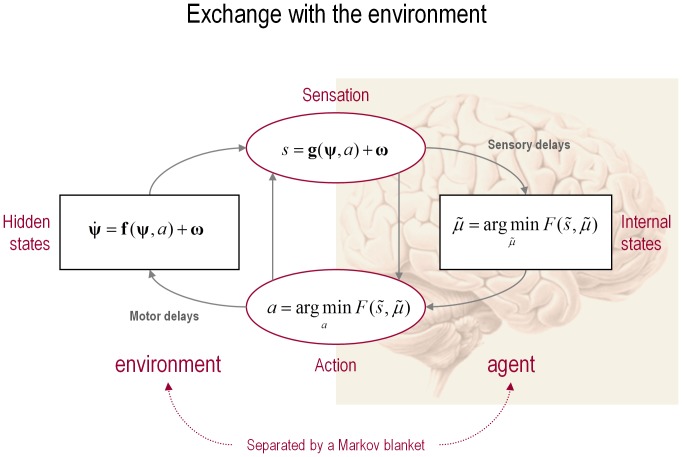
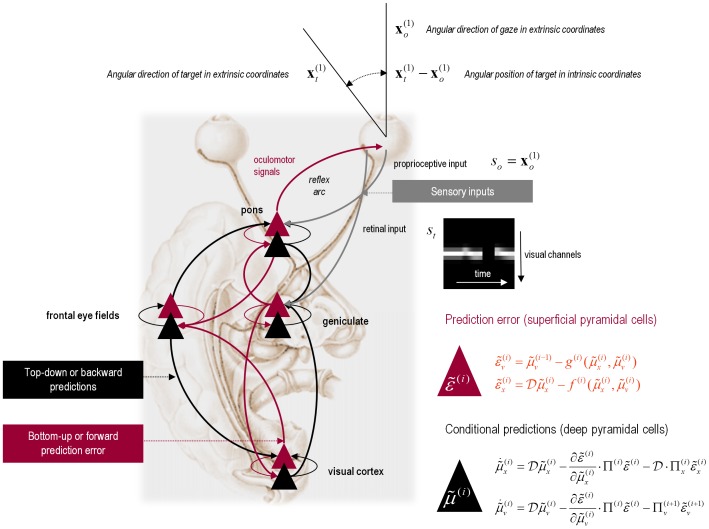
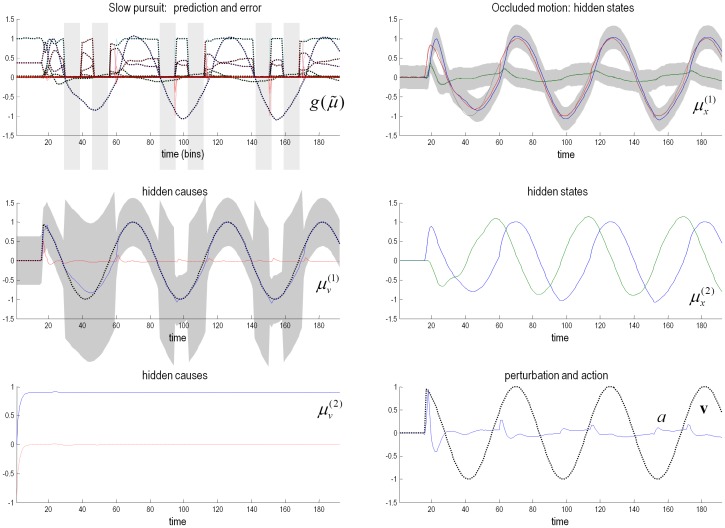
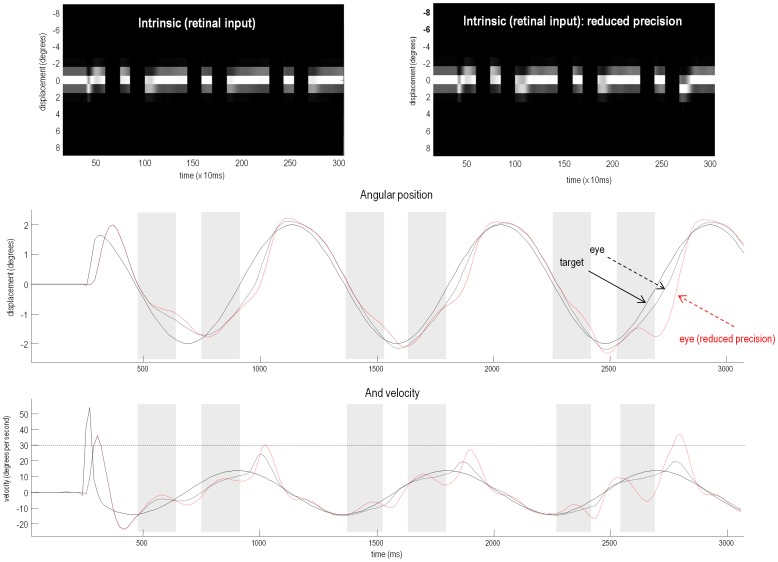
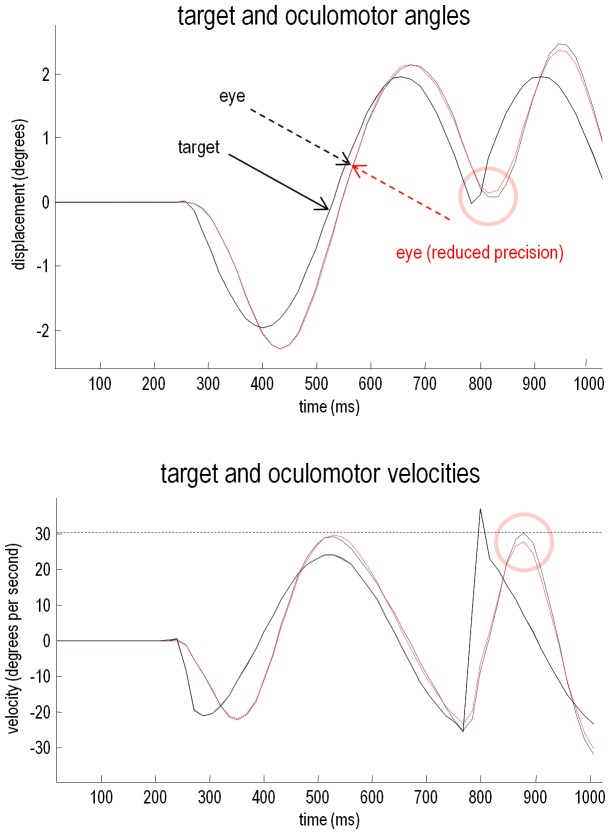
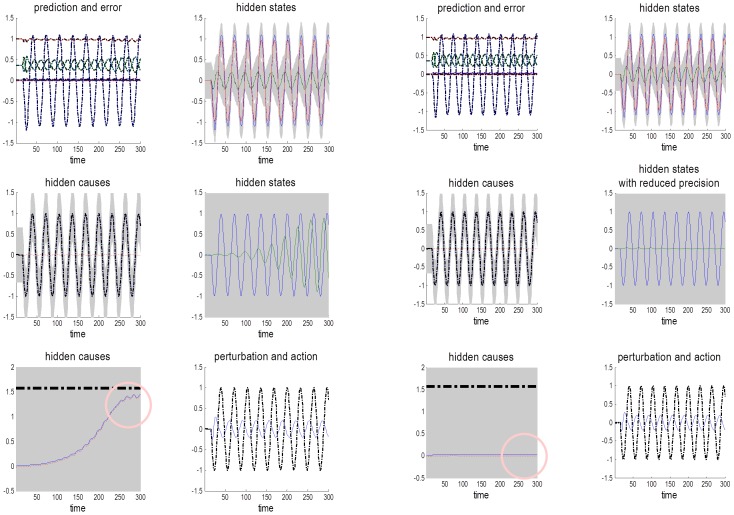
This paper introduces a model of oculomotor control during the smooth pursuit of occluded visual targets. This model is based upon active inference, in which subjects try to minimise their (proprioceptive) prediction error based upon posterior beliefs about the hidden causes of their (exteroceptive) sensory input. Our model appeals to a single principle--the minimisation of variational free energy--to provide Bayes optimal solutions to the smooth pursuit problem. However, it tries to accommodate the cardinal features of smooth pursuit of partially occluded targets that have been observed empirically in normal subjects and schizophrenia. Specifically, we account for the ability of normal subjects to anticipate periodic target trajectories and emit pre-emptive smooth pursuit eye movements--prior to the emergence of a target from behind an occluder. Furthermore, we show that a single deficit in the postsynaptic gain of prediction error units (encoding the precision of posterior beliefs) can account for several features of smooth pursuit in schizophrenia: namely, a reduction in motor gain and anticipatory eye movements during visual occlusion, a paradoxical improvement in tracking unpredicted deviations from target trajectories and a failure to recognise and exploit regularities in the periodic motion of visual targets. This model will form the basis of subsequent (dynamic causal) models of empirical eye tracking measurements, which we hope to validate, using psychopharmacology and studies of schizophrenia.


Conflict of interest statement

Competing Interests: The authors have declared that no competing interests exist.

Figures

Figure 1
Figure 1. Exchange with the environment.
This schematic shows the dependencies among various quantities modelling exchanges of an agent with the environment. It shows the states of the environment and the system in terms of a probabilistic dependency graph, where connections denote directed dependencies. The quantities are described within the nodes of this graph – with exemplar forms for their dependencies on other variables (see main text). Hidden (external) and internal states of the agent are separated by action and sensory states. Both action and internal states – encoding a conditional probability density function over hidden states – minimise free energy. Note that hidden states in the real world and the form of their dynamics can be different from that assumed by the generative model; this is why hidden states are in bold. See main text for further details.
Figure 2
Figure 2. Hierarchical message passing in the visual-oculomotor system.
Schematic detailing a neuronal message passing scheme (generalised Bayesian filtering or predictive coding) that optimises conditional expectations about hidden states of the world, given sensory (visual) data and the active (oculomotor) sampling of those data. This diagram shows the speculative cells of origin of forward driving connections (in red) that convey prediction error from a lower area to a higher area and the backward connections (in black) that construct predictions . These predictions try to explain away prediction error in lower levels. In this scheme, the sources of forward and backward connections are superficial (red) and deep (black) pyramidal cells respectively. The equations on the right represent a generalised descent on free energy under the hierarchical model described in the main text – this can be regarded as a generalisation of predictive coding or Kalman filtering: see . State-units are in black and error-units are in red. Here, we have placed different levels of some hierarchical model within the visual-oculomotor system. Visual input (illustrated in the retinal input graph) arrives in an intrinsic (retinal) frame of reference that depends upon the angular position of a stimulus and the direction of gaze. Exteroceptive input is then passed to the lateral geniculate nuclei (LGN) and to higher visual (we are merging V1–V5) and prefrontal (e.g., frontal eye fields) areas in the form of prediction errors. Crucially, proprioceptive sensations are also predicted, creating prediction errors at the level of the cranial nerve nuclei (pons). The special aspect of these proprioceptive prediction errors is that they can be resolved through classical reflex arcs – in other words, they can elicit action to change the direction of gaze and close the visual–oculomotor loop.
Figure 3
Figure 3. Simulation of smooth pursuit of a partially occluded target.
This figure reports the conditional estimates of hidden states and causes during the simulation of smooth pursuit eye movements, using horizontal sinusoidal target motion with a period of 56 time bins – starting at 16 time bins. All times are measured in 16 ms time bins. The target was occluded whenever it passed behind an occluder at a leftward displacement of 0.1° to 1.8° of visual angle. The upper left panel shows the predicted sensory input (coloured lines) and sensory prediction errors (dotted red lines) along with the true sensory input (broken black lines). The different coloured lines correspond to photoreceptor activity over the array of (17) sensory inputs. The proprioceptive sensations (blue lines) reflect a veridical smooth pursuit, even during occlusion, indicated by the light grey bars. These sensory predictions are based upon the conditional expectations of hidden oculomotor (blue line) and target (red line) angular displacements shown on the upper right. The grey regions correspond to 90% Bayesian confidence intervals and the broken black lines show the true values. The hidden cause of these displacements (broken black line) is shown with its conditional expectation (blue line) in the middle left panel where the prediction error on this hidden cause shown as a dotted red line. Note the increase in uncertainty about this hidden cause during the periods of occlusion; however, this uncertainty is moderated because the hidden cause is informed by the motion of hidden states at the second level – shown on the middle right. These show the anticipated periodic dynamics of appropriate amplitude to minimise prediction errors at lower levels in the hierarchy. The period of these dynamics is fixed by the hidden cause at the second level, as shown on the lower left – where the conditional expectation (blue line) reaches its prior expectation almost immediately. The true cause and action (Equation 5) are shown on the lower right. The action (blue line) is responsible for oculomotor displacements and is driven by proprioceptive prediction errors.
Figure 4
Figure 4. Smooth pursuit of a partially occluded target with and without high-level precision.
The panels of this figure show the results of the previous in a different format: the upper left panel shows the responses of each of the (17) photoreceptors in image format as a function of peristimulus time. This shows the small fluctuations in signal that are due to imperfect pursuit and consequent retinal slip at the onset of target motion. Later, during periods of occlusion, the sensory input disappears. The lower panels show the angular displacement (top) and velocity (bottom) of the target (solid lines) and eye (broken lines) as a function of peristimulus time. The grey area corresponds to the period of visual occlusion. The equivalent results – when the precisions of prediction errors on the motion of hidden states at the second level were reduced from a log precision of −1 to −1.25 – are shown in the upper right panel and as red broken lines in the lower panels. The broken horizontal line in the lower panel corresponds to an angular velocity (30°/s) at which the eye movement could be considered saccadic. Please refer to the main text for a detailed description.
Figure 5
Figure 5. Smooth pursuit with an unexpected trajectory change, with and without high-level precision.
This figure reports the results of simulations using an occluded periodic motion with a reversal in the direction of the trajectory at the beginning of the second cycle (plain black line). The broken traces in black correspond to normal pursuit and the broken traces in red show the performance under reduced precision. Although the effect is small, the low precision simulation shows more accurate pursuit performance, both in terms of the displacement between the target and centre of gaze and in terms of a slight reduction in the peak velocity during the compensatory eye movement (pink circles).
Figure 6
Figure 6. Failure to infer high-level causes when precision is low.
This figure shows the results of simulating numerous cycles of periodic motion starting with a prior expectation about its frequency of zero. The panels on the left show the results of a simulation with normal precision, while the right panels present the equivalent results under lower precision. These panels use the same format as Figure 3, including time which is measured in 16 ms bins. The key result here is a failure to infer the true level (broken black lines in the lower left panels) of the hidden cause at the highest level (blue lines) when precision is low (pink circles).

References

    1. Feldman H, Friston KJ (2010) Attention, uncertainty, and free-energy. Front Hum Neurosci 4: 215 doi:10.3389/fnhum.2010.00215 - DOI - PMC - PubMed
    1. Laruelle M, Kegeles LS, Abi-Dargham A (2003) Glutamate, dopamine, and schizophrenia: from pathophysiology to treatment. Ann N Y Acad Sci 1003: 138–158. - PubMed
    1. Bennett SJ, Barnes GR (2003) Human ocular pursuit during the transient disappearance of a visual target. J Neurophysiol 90: 2504–2520 doi:10.1152/jn.01145.2002 - DOI - PubMed
    1. Thaker GK, Ross DE, Buchanan RW, Adami HM, Medoff DR (1999) Smooth pursuit eye movements to extra-retinal motion signals: deficits in patients with schizophrenia. Psychiatry Res 88: 209–219. - PubMed
    1. Hong LE, Avila MT, Thaker GK (2005) Response to unexpected target changes during sustained visual tracking in schizophrenic patients. Exp Brain Res 165: 125–131 doi:10.1007/s00221-005-2276-z - DOI - PubMed

Publication types