. 2012 Oct 30:1:e00031.
doi: 10.7554/eLife.00031.

Foggy perception slows us down

Affiliations

Foggy perception slows us down

Paolo Pretto et al. Elife. .

Abstract

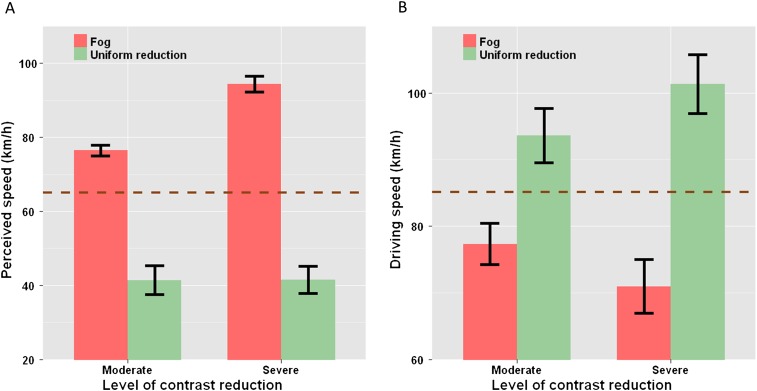
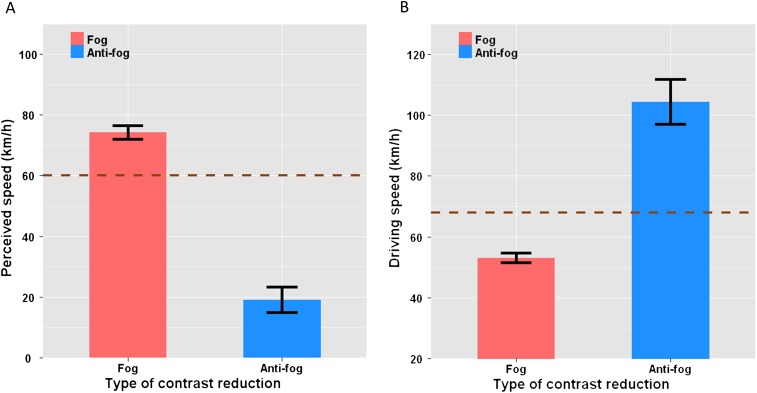
Visual speed is believed to be underestimated at low contrast, which has been proposed as an explanation of excessive driving speed in fog. Combining psychophysics measurements and driving simulation, we confirm that speed is underestimated when contrast is reduced uniformly for all objects of the visual scene independently of their distance from the viewer. However, we show that when contrast is reduced more for distant objects, as is the case in real fog, visual speed is actually overestimated, prompting drivers to decelerate. Using an artificial anti-fog-that is, fog characterized by better visibility for distant than for close objects, we demonstrate for the first time that perceived speed depends on the spatial distribution of contrast over the visual scene rather than the global level of contrast per se. Our results cast new light on how reduced visibility conditions affect perceived speed, providing important insight into the human visual system.DOI:http://dx.doi.org/10.7554/eLife.00031.001.

Keywords: Human; driving simulation; human psychophysics; motion perception; virtual reality.


Conflict of interest statement

The authors have declared that no competing interests exist.

Figures

Figure 1.
Figure 1.. Experimental design and time course of trials.
(A) Experiments 1 and 3: for each trial, the first scene was presented for 700 ms, which included a 100-ms fade-in phase at the beginning and a 100-ms fade-out phase at the end. The second scene was presented 300 ms after the end of the first scene and had the same temporal structure as the first one. Participants had to fixate a central cross for the whole duration of the trial. The order of presentation of the reference and test scene was randomized. (B) Experiments 2 and 4: three driving sessions (i.e., one per target speed) were performed in random order for experiment 2, and one session for experiment 4. Before each test session, the drivers performed a training phase in which a numerical feedback indicated the driving speed when it did not match the target speed (white digits at the bottom of the screen, left panel). In each training phase, the drivers had to drive a total of 5 min at target speed. In addition, at the beginning of each test trial, the scene was shown for 7 s moving at target speed with clear visibility (memory refresher). DOI: http://dx.doi.org/10.7554/eLife.00031.003
Figure 2.
Figure 2.. Visibility conditions.
(A) Clear weather conditions (clear visibility): contrast is unaltered and the visibility is optimal in all directions (brown line). (B) Distance-independent contrast reduction (uniform contrast): visibility drops equally for all objects of the visual scene, irrespective of their distance from the observer (green lines). (C) Distance-dependent contrast reduction (fog): visibility is good for close objects, and worsens as distance from the observer increases (red lines). (D) Reversed distance-dependent contrast reduction (anti-fog): visibility is poor for close objects, and improves as distance from the observer increases (blue lines). (E) Pictures of the actual setup: side view (left) and driver's view (right). DOI: http://dx.doi.org/10.7554/eLife.00031.004
Figure 3.
Figure 3.. Opposite effects of distance-dependent and distance-independent contrast reduction. Experiments 1 and 2.
(A) Mean perceived driving speed across subjects as a function of visibility: for each subject, PSE values were averaged across the three target speeds (i.e., 40, 60, and 90 km/hr), then perceived speed was calculated using the following equation: Speedperceived = PSEclear + PSEclear × ln(PSEclear/PSEreduced visibility). As compared to clear visibility (brown dashed line), speed was overestimated with distance-dependent visibility reduction (red bars) and underestimated with distance-independent visibility reduction (green bars). (B) Mean produced driving speed across subjects as a function of visibility: for each subject, measured speed values were averaged across the three target speeds. As compared to their driving speed with clear visibility (brown dashed line), drivers drove slower with distance-dependent visibility reduction (red bars) and faster with distance-independent visibility reduction (green bars). In both (A) and (B), the error bars represent the standard error of the mean. PSE: point of subjective equality. DOI: http://dx.doi.org/10.7554/eLife.00031.005
Figure 4.
Figure 4.. Opposite effects of fog and anti-fog. Experiments 3 and 4.
(A) Mean perceived driving speed across subjects as a function of visibility: Perceived speed was calculated from the measured PSEs using the following equation: Speedperceived = PSEclear + PSEclear × ln(PSEclear/PSEreduced visibility). As compared to clear visibility (brown dashed line), speed was overestimated when visibility was better for close than for distant objects, that is, in fog (red bars), and underestimated when visibility was better for distant than for close objects, that is, anti-fog (blue bars). (B) Mean produced driving speed across subjects as a function of visibility: As compared to their driving speed with clear visibility (brown dashed line), drivers drove slower when visibility was better for close than for distant objects, that is, in fog (red bars), and faster when visibility was better for distant than for close objects, that is, anti-fog (blue bars). In both (A) and (B), the error bars represent the standard error of the mean. PSE: point of subjective equality. DOI: http://dx.doi.org/10.7554/eLife.00031.006

Comment in

  • doi: 10.7554/eLife.00281

References

    1. Anstis S. 2003. Moving objects appear to slow down at low contrasts. Neural Netw 16:933–8 - PubMed
    1. Bartels A, Zeki S, Logothetis NK. 2008. Natural vision reveals regional specialization to local motion and to contrast-invariant, global flow in the human brain. Cereb Cortex 18:705–17 - PubMed
    1. Blakemore MR, Snowden RJ. 1999. The effect of contrast upon perceived speed: a general phenomenon? Perception 28:33–48 - PubMed
    1. Engel W. 2005. SHADERX3: Advanced Rendering with DirectX and OpenGL: Charles River Media. Hingham, MA, USA
    1. Hammett ST, Thompson PG, Bedingham S. 2000. The dynamics of velocity adaptation in human vision. Curr Biol 10:R882. - PubMed

Publication types