Review
. 2012;12(18):2002-12.
doi: 10.2174/156802612804910313.

Rational prediction with molecular dynamics for hit identification

Affiliations
Free PMC article
Review

Rational prediction with molecular dynamics for hit identification

Sara E Nichols et al. Curr Top Med Chem. 2012.
Free PMC article

Abstract

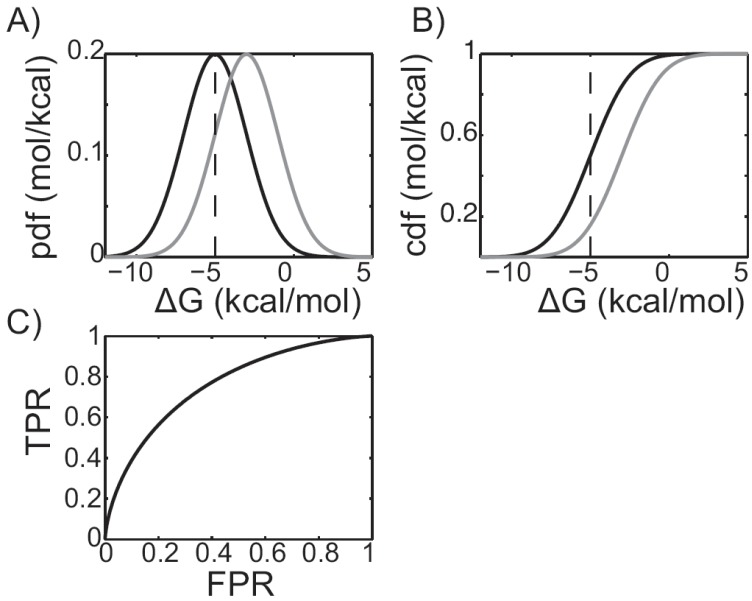
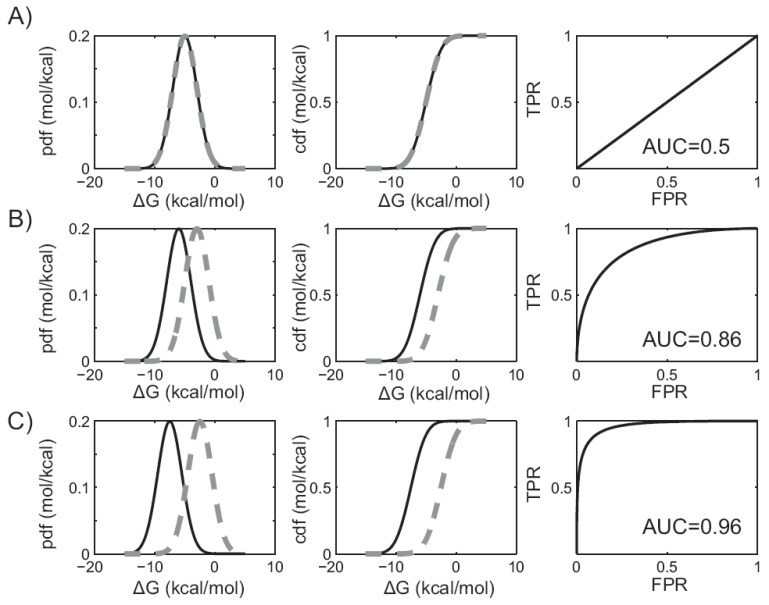
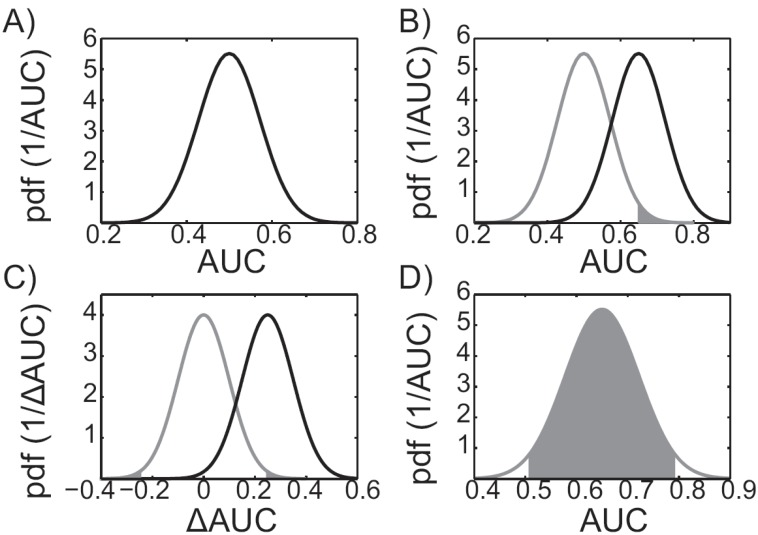
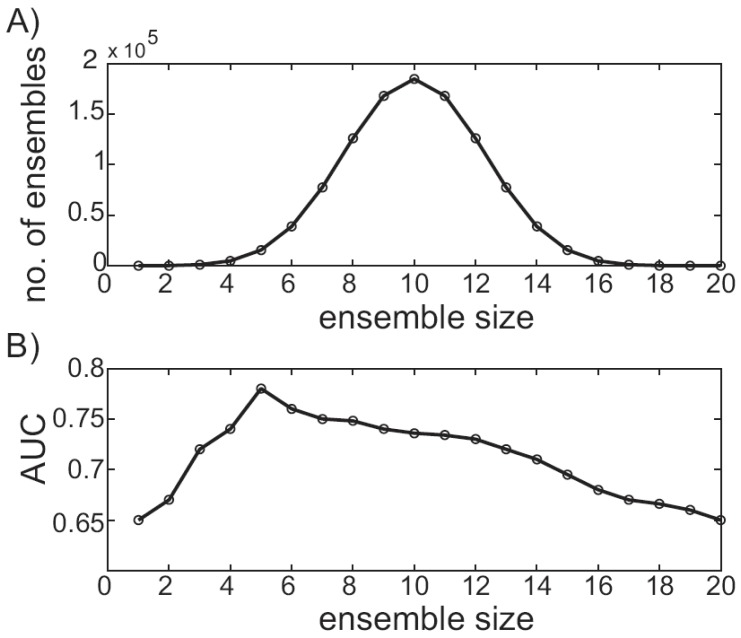
Although the motions of proteins are fundamental for their function, for pragmatic reasons, the consideration of protein elasticity has traditionally been neglected in drug discovery and design. This review details protein motion, its relevance to biomolecular interactions and how it can be sampled using molecular dynamics simulations. Within this context, two major areas of research in structure-based prediction that can benefit from considering protein flexibility, binding site detection and molecular docking, are discussed. Basic classification metrics and statistical analysis techniques, which can facilitate performance analysis, are also reviewed. With hardware and software advances, molecular dynamics in combination with traditional structure-based prediction methods can potentially reduce the time and costs involved in the hit identification pipeline.


Figures

Fig. (1)
Fig. (1)
Receiver Operating Characteristic (ROC) plots. A) Predicted binding affinity probability distribution functions (pdfs) of the actives, shown in black, and inactives, shown in grey, for a hypothetical virtual screening experiment. A -5 kcal/mol threshold is shown as a grey, vertical dashed line. Compounds whose scores lie to the left of the line are experimentally assayed. Compounds whose scores lie to the right are not. B) The integrals of the pdfs, or cumulative distribution functions (cdfs). The black cdf is equivalent to the true positive rate (TPR), while the grey cdf is equivalent to the false positive rate (FPR). C) A ROC plot, generated by plotting the gray cdf along the X-axis versus the black cdf along the Y-axis.
Fig. (2)
Fig. (2)
The area under the ROC curve and virtual screening performance. In figures A) through C), plots in the leftmost column describe the predicted binding affinity probability distributions. Plots in the middle column give the corresponding cumulative distribution functions. The binders are shown in solid black, while the non-binders are shown in dashed grey. Plots in the right column show the corresponding ROC curves. AUC values are shown for three different hypothetical virtual screening protocols with A) no discriminatory power, B) improved discriminatory power, or C) near perfect discrimination.
Fig. (3)
Fig. (3)
Performance evaluation statistics. A) Distribution of a virtual screening protocol that performs randomly, on average. B) An example p-value for a hypothetical virtual screening experiment with an AUC of 0.65 is illustrated as the shaded area under the null distribution, shown in grey. The alternative distribution, corresponding to the alternative hypothesis, is shown in black. C) The null distribution corresponding to the null hypothesis, “the two docking protocols perform identically,” is shown in grey. The p-value corresponding to two virtual screening experiments whose ΔAUC value is 0.25 is illustrated as the shaded areas under the grey null-distribution curve. The corresponding alternative distribution is shown in black. D) The 95% confidence interval of a hypothetical virtual screening protocol with an observed AUC value of 0.65. The 95% confidence interval is bounded by the grey shaded region, which contains 95% of the distribution.
Fig. (4)
Fig. (4)
Ensemble size and virtual screening performance variability. A) For 20 receptor conformations, the number of ensembles that can be constructed is plotted as a function of the ensemble size. B) For a hypothetical ensemble-based virtual screening experiment, the AUC of the top-performing ensemble is plotted as a function of ensemble size.
Fig. (5)
Fig. (5)
Exponential increase in molecular dynamics citations. Searches using the quoted keywords were performed using SciFinder Scholar. The number of citations returned is plotted as a function of year, indicating the increasing use of molecular dynamics in drug discovery.

References

    1. Amaro RE, and W.W Li. Emerging methods for ensemble-based virtual screening. Curr. Top. Med. Chem. 2010;10(1):3–13. - PMC - PubMed
    1. Lexa KW, and H.A Carlson. Protein flexibility in docking and surface mapping. Q. Rev. Biophys. 2012;1(1):1–42. - PMC - PubMed
    1. B-Rao C, J Subramanian, and SD Sharma. Managing protein flexibility in docking and its applications. Drug Discovery Today. 2009;14(7-8):394–400. - PubMed
    1. Henzler AM, and M Rarey. In pursuit of fully fexible protein-ligand docking: Modeling the bilateral mechanism of binding. Mol. Inform. 2010;29(3):164–173. - PubMed
    1. Lill MA. Efficient incorporation of protein flexibility and dynamics into molecular docking simulations. Biochemistry. 2011;50(28):6157–6169. - PMC - PubMed

Publication types