. 2012 Oct 30:13:279.
doi: 10.1186/1471-2105-13-279.

ChopSticks: High-resolution analysis of homozygous deletions by exploiting concordant read pairs

Affiliations

ChopSticks: High-resolution analysis of homozygous deletions by exploiting concordant read pairs

Tomohiro Yasuda et al. BMC Bioinformatics. .

Abstract

Background: Structural variations (SVs) in genomes are commonly observed even in healthy individuals and play key roles in biological functions. To understand their functional impact or to infer molecular mechanisms of SVs, they have to be characterized with the maximum resolution. However, high-resolution analysis is a difficult task because it requires investigation of the complex structures involved in an enormous number of alignments of next-generation sequencing (NGS) reads and genome sequences that contain errors.

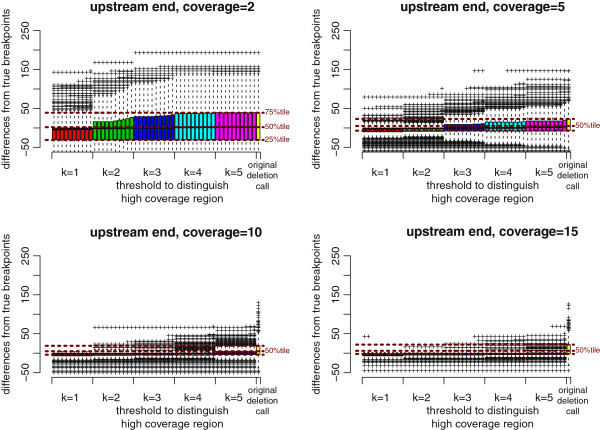
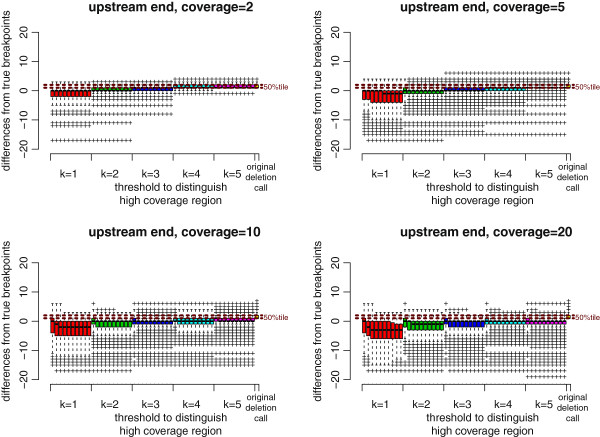
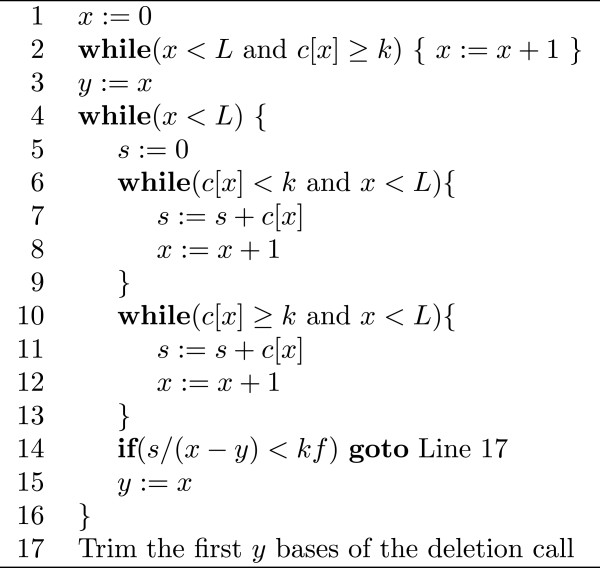
Results: We propose a new method called ChopSticks that improves the resolution of SV detection for homozygous deletions even when the depth of coverage is low. Conventional methods based on read pairs use only discordant pairs to localize the positions of deletions, where a discordant pair is a read pair whose alignment has an aberrant strand or distance. In contrast, our method exploits concordant reads as well. We theoretically proved that when the depth of coverage approaches zero or infinity, the expected resolution of our method is asymptotically equal to that of methods based only on discordant pairs under double coverage. To confirm the effectiveness of ChopSticks, we conducted computational experiments against both simulated NGS reads and real NGS sequences. The resolution of deletion calls by other methods was significantly improved, thus demonstrating the usefulness of ChopSticks.

Conclusions: ChopSticks can generate high-resolution deletion calls of homozygous deletions using information independent of other methods, and it is therefore useful to examine the functional impact of SVs or to infer SV generation mechanisms.


Figures

Figure 1
Figure 1
Resolution improvement by exploiting concordant read pairs. Schematic illustration of the key idea of our method ChopSticks. Unlike conventional SV detection methods based only on discordant pairs whose mapping distances were not close to the expectation, ChopSticks uses concordant read pairs as well. There is a chance that there is a concordant read closer to the boundary of the deleted region (breakpoint) than any discordant reads. Such a concordant read localizes the predicted position of the breakpoint, and therefore it contributes to achieving a high resolution. In this figure, b is the upstream end of a true deletion, Δb is the distance between the upstream end of a true deletion and that of a deletion call by threshold-based read-pair (RP) methods. Similarly, Δb is defined for our method. The expected values of Δband Δb are given by Equations (2) and (3), respectively.
Figure 2
Figure 2
Expected resolutions of ChopSticks and threshold-based RP methods. The expected resolution of our method (E[Δb|b,c]) is shown by a thick red line, that of threshold-based RP methods (E[Δb|b,c]) is shown by a thin solid black line, and that of threshold-based RP methods with double coverage (E[Δb|b,2c]) is shown by a dashed black line. The difference between E[Δb|b,c] and E[Δb|b,2c] is also shown by a dotted blue line. As the coverage goes away from zero, the resolution obtained by our method quickly outperforms that of normal RP methods. It is also clear that the resolution of our method is very close to that of threshold-based RP methods with double coverage. The difference approaches zero when coverage approaches zero or infinity, as indicated by the blue dotted line. E[Δb|b,c], E[Δb|b,c], and E[Δb|b,2c] are given by Equations (2), (3), and (5), respectively. In this figure, d=200 and r=100.
Figure 3
Figure 3
Overview of trimming algorithm of ChopSticks. Schematic illustration of the trimming algorithm of ChopSticks. ChopSticks trims ends of deletion calls that are not likely to be parts of deletions, according to their coverage. First, it trims high-coverage regions at the ends of deletion calls. Here, a high-coverage region is a region whose coverage is greater than a given parameter k. Second, it recognizes a high-coverage region separated by a low-coverage region and trims these regions if their joint coverage is deeper than kf, where f is another parameter. The second step is repeatedly conducted until the joint coverage becomes less than kf .
Figure 4
Figure 4
Recall and precision of results of SV detection tools. BreakDancer and CLEVER achieved relatively good recall for all coverage, while recall of MoDIL was low. Although recall of CNVnator was not bad, its precision was low. The recall of an SR method Pindel was good when coverage was high, but it was insufficient when coverage was low.
Figure 5
Figure 5
Number of deletion calls covering the whole of true deletions. Solid lines and circles show the number of all deletion calls generated by each tool, whereas dashed lines and ‘+’ symbol s show the number of deletion calls covering the whole of true deletions. Most of the deletion calls of MoDIL, CNVnator (expanded by the window size), and Pindel covered the whole of true deletions. On the other hand, many CLEVER results did not always contain the whole of true deletions, while median of the distribution of predicted breakpoints was close to the true breakpoints as shown in Figure 10. BreakDancer results for high coverage data did not always contain true deletions either. Predicted breakpoints of BreakDancer approached true breakpoints as the depth of coverage increases, and sometimes intruded into true deletions when coverage was high.
Figure 6
Figure 6
BreakDancer results improved by ChopSticks. Box-and-whisker plots of upstream differences of deletion calls obtained by BreakDancer and those improved by ChopSticks. The red, green, blue, light blue, and magenta boxes correspond to k values of 1, 2, 3, 4, and 5, respectively, and the rightmost yellow box corresponds to the original results of BreakDancer. Among boxes of the same color, from left to right, f=0.1, 0.2, …, 1.0. Brown horizontal dashed lines indicate the values of 25%, 50%, and 75% tiles of differences of original deletion calls from below to above, respectively. The results in this figure indicate that ChopSticks clearly improved the resolution of the original BreakDancer results. When the coverage was low, small k values were effective in improving the resolution. When coverage was high, the resolution was also improved for large k values. Therefore, when the coverage is high, we recommend using large k values to avoid erroneous alignments of NGS reads and the genome. We omitted the results for coverage=15 because they were similar to those for coverage=20.
Figure 7
Figure 7
Distribution of differences of BreakDancer results and those improved by ChopSticks. The distribution of differences of ChopSticks results concentrated around zero, whereas that of BreakDancer results had long tail in 0–50 bp. Here, k=2, f=0.5, and coverage=5. Each frequency corresponds to the number of differences in bins of 2 bp.
Figure 8
Figure 8
Scatter plot of deletion lengths and differences of deletion calls. No correlation between deletion lengths and differences was observed (r2=0.056). ChopSticks worked well regardless of deletion lengths. Here, k=2, f=0.5, and coverage=5.
Figure 9
Figure 9
MoDIL results improved by ChopSticks. Box-and-whisker plots of upstream differences of deletion calls obtained by MoDIL and those improved by ChopSticks. The format of this plot is exactly the same as that in Figure 6, except that results for coverage=15 were shown instead of those for coverage=20. The results in this figure indicate that ChopSticks can also improve the resolution of MoDIL results.
Figure 10
Figure 10
CLEVER results improved by ChopSticks. Box-and-whisker plots of upstream differences of deletion calls obtained by CLEVER and those improved by ChopSticks. The differences were successfully corrected. Note that a significant portion of breakpoints predicted by CLEVER were inside the true deletion. Nonetheless, ChopSticks selectively trimmed predicted breakpoints outside true deletions, and left those inside untouched.
Figure 11
Figure 11
Distribution of differences of CLEVER results and those improved by ChopSticks. The distribution of differences of CLEVER results had long tail in 0–50 bp, whereas that improved by ChopSticks concentrates around zero. Here, k=2, f=0.5, and coverage=5. Each frequency corresponds to the number of displacements in bins of 2 bp.
Figure 12
Figure 12
CNVnator results improved by ChopSticks. Box-and-whisker plots of upstream differences of deletion calls obtained by CNVnator and those improved by ChopSticks. The format of this plot is exactly the same as that in Figure 6. We expanded the original deletion calls of CNVnator outward by the window size (50 bp) because ChopSticks assumes that predicted breakpoints are outside true deletions. The results in this figure indicate that ChopSticks can improve the resolution of CNVnator results if predicted positions of breakpoints are within a few hundreds of bases from true breakpoints.
Figure 13
Figure 13
Pindel results and those modified by ChopSticks. Box-and-whisker plots of upstream differences of deletion calls obtained by Pindel and those modified by ChopSticks. The format of this plot is exactly the same as in Figure 6. The results in this figure indicate that ChopSticks should not be applied to the Pindel results because the resolution of the Pindel results is already quite high.
Figure 14
Figure 14
BreakDancer results for DBA/2J reads improved by ChopSticks. Box-and-whisker plots of upstream and downstream differences of deletion calls obtained by BreakDancer and those improved by ChopSticks. The results in this figure indicate that ChopSticks can improve the resolution of deletion calls for real sequences. Although ChopSticks trimmed upstream ends of a few deletion calls too much when k=1 or k=2 and f was small, such problems quickly disappeared for greater k and f values.
Figure 15
Figure 15
Distribution of differences of BreakDancer results and those improved by ChopSticks. The distribution of differences of BreakDancer results had long tail in 0–400 bp, whereas that improved by ChopSticks concentrates around zero and frequencies in the long tail were reduced. Here, k=2, f=0.5. Each frequency corresponds to the number of differences in bins of 20 bp.
Figure 16
Figure 16
Distribution of differences of CLEVER results and those improved by ChopSticks. ChopSticks corrected some of breakpoints predicted by CLEVER so that the peak at zero became stronger. However, the distribution of differences of CLEVER results had long tail in 0–3000 bp and it was difficult for ChopSticks to correct such large differences. Here, k=2, f=0.5. Each frequency corresponds to the number of differences in bins of 20 bp.
Figure 17
Figure 17
Pseudocode of trimming algorithm. Pseudocode of the trimming algorithm of ChopSticks. Here, L is the length of the deletion call being processed, k is a threshold used to discriminate high-coverage regions from low-coverage ones, and f is a parameter that determines the threshold of the coverage of regions to be trimmed. The variable x represents the position of the base being examined, and the variable y represents the length of a region to be trimmed. The value c[x] is the coverage at the x-th base in the deletion call, while s keeps the sum of c[x] values.
Figure 18
Figure 18
Distribution of deletion lengths in our simulation.
Figure 19
Figure 19
Distribution of deletion lengths detected with Sanger reads.

Similar articles

Cited by

References

    1. Illumina Sequencing portfolio. [ http://www.illumina.com/systems/sequencing.ilmn]
    1. The 1000 genomes project consortium. A map of human genome variation from population-scale sequencing. Nature. 2010;467:1061–1073. doi: 10.1038/nature09534. - DOI - PMC - PubMed
    1. Mills RE, Walter K, Stewart C, Handsaker RE, Chen K, Alkan C, Abyzov A, Yoon SC, Ye K, Cheetham RK, Chinwalla A, Conrad DF, Fu Y, Grubert F, Hajirasouliha I, Hormozdiari F, Iakoucheva LM, Iqbal Z, Kang S, Kidd JM, Konkel MK, Korn J, Khurana E, Kural D, Lam HYK, Leng J, Li R, Li Y, Lin CY, Luo R. et al.1000 genomes project: Mapping copy number variation by population-scale genome sequencing. Nature. 2011;470:59–65. doi: 10.1038/nature09708. - DOI - PMC - PubMed
    1. Medvedev P, Stanciu M, Brudno M. Computational methods for discovering structural variation with next-generation sequencing. Nat Methods. 2009;6:S13—S20. - PubMed
    1. Chen K, Wallis JW, McLellan MD, Larson DE, Kalicki JM, Pohl CS, McGrath SD, Wendl MC, Zhang Q, Locke DP, Shi X, Fulton RS, Ley TJ, Wilson RK, Ding L, Mardis ER. BreakDancer: an algorithm for high-resolution mapping of genomic structural variation. Nat Methods. 2009;6:677–681. doi: 10.1038/nmeth.1363. - DOI - PMC - PubMed

LinkOut - more resources