. 2013 Feb 1:66:376-84.
doi: 10.1016/j.neuroimage.2012.10.037. Epub 2012 Oct 27.

Connective field modeling

Affiliations

Connective field modeling

Koen V Haak et al. Neuroimage. .

Abstract

The traditional way to study the properties of visual neurons is to measure their responses to visually presented stimuli. A second way to understand visual neurons is to characterize their responses in terms of activity elsewhere in the brain. Understanding the relationships between responses in distinct locations in the visual system is essential to clarify this network of cortical signaling pathways. Here, we describe and validate connective field modeling, a model-based analysis for estimating the dependence between signals in distinct cortical regions using functional magnetic resonance imaging (fMRI). Just as the receptive field of a visual neuron predicts its response as a function of stimulus position, the connective field of a neuron predicts its response as a function of activity in another part of the brain. Connective field modeling opens up a wide range of research opportunities to study information processing in the visual system and other topographically organized cortices.

Keywords: Connective field; Functional connectivity; Population receptive field; Visual cortex; fMRI.


Figures

Figure 1
Figure 1
Connective field models follow the curvature of the cortex. A two-dimensional, Gaussian connective field model (top-left) if defined as a function of Dijkstra’s shortest path distance between pairs of vertices in a three-dimensional mesh representation of the original, folded cortical surface (top-right). The advantage of this approach is that the measurement of cortical distance avoids the distortions introduced if the Gaussian were projected onto a flattened, two-dimensional cortical surface representation. Panels 1, 2 and 3 (bottom) further illustrate the connective field model projection when the surface mesh is unfolded (smoothed).
Figure 2
Figure 2
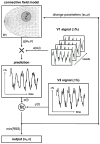
Estimating the V1 ➤ V2 connective field for a V2 voxel. Assuming a linear relationship between the blood-oxygenation levels and the fMRI signals, the observed blood-oxygenation level-dependent (BOLD) time course, y(t), can be described in terms of the predicted BOLD signal, p(t). The prediction, p(t), is calculated using a parametrized model of the connective field. The parameters of the connective field model are its center location, v0, in voxel coordinates, and the Gaussian spread, σ, laid out across the folded cortical surface in millimeters cortex. The definition of this circular symmetric Gaussian model is achieved by its projection on a three-dimensional mesh representation of the boundary between the gray and white matter of the brain. The predicted BOLD time course, p(t), for a V2 voxel is then obtained by calculating the overlap between the connective field, g(v0,σ), and the fMRI signals in V1, a(v,t). Finally, the optimal connective field model parameters are found by minimizing the residual sum of squares (RSS) between the prediction, p(t), and the observed time series, y(t).
Figure 3
Figure 3
Examples of the connective field model fit to the BOLD time-series at voxels in V2 and V4. The BOLD time-series are indicated by the dotted lines. The conventional pRF model predictions are indicated by the solid blue lines. The connective field model predictions are indicated by the solid red lines. The connective field models are shown on an inflated portion of the left occipital lobe (medial view) on the right. (a) The V1 ➤ V2 connective field model fits the BOLD time-series very well, explaining 72.2% of the variance. For this particular V2 voxel the best-fitting connective field radius is 3.1 mm. (b) The best-fitting V1 ➤ V4 connective field model yields a radius of 10.2 mm. The BOLD time series variance explained by this model is 66.7%. Also note that the pRF model captures the peaks quite well (when the stimulus passes through the receptive field) but that it misses some of the ripples that occur when the stimulus is not directly on the receptive field. The connective field model, by contrast, does capture some of these fluctuations, which is one of the differences between the connective field model and the pRF model: the pRF model will never make accurate predictions when there is no stimulus.
Figure 4
Figure 4
Stimulus- and neural-referred maps on the posterior medial surface of the occipital lobe of the left cerebral hemisphere at 7 Tesla. (a, b) Stimulus-referred eccentricity and polar angle maps revealed using conventional pRF modeling. The pRF eccentricity and pRF polar angle were used to delineate visual areas V1-hV4. Insets indicate the color maps that define the visual field locations. (c) The stimulus-referred pRF size estimates, as indicated by the colors shown in the color bar. The pRF size increases with eccentricity for all visual areas shown. (d, e) Neural-referred eccentricity and polar angle maps derived from the best-fitting V1 ➤ {V2, V3, hV4} connective field models in visual areas V2-hV4. The insets indicate the color maps that define the cortical locations, which are the V1 maps shown panels a and b. (f) The neural-referred connective field size, as indicated by the colors shown in the color bar.
Figure 5
Figure 5
The relationship between eccentricity and V1-referred connective field size in visual areas V2-hV4, grouped from both participants and all voxel sizes. (a) The connective field size increases up the visual processing hierarchy and is dependent on eccentricity. (b) The connective field size decreases as a function of the pRF laterality index, which indicates the extent to which a pRF overlaps with the ipsilateral visual field (0 represents no overlap, 0.5 represents 50% overlap). (c) Adjusting the graph in a for pRF laterality yields the V1 sampling extent, which appears roughly constant across eccentricities. Colored lines represent a linear fit to the bins (dots). The bins were bootstrapped and linear fits repeated to give the 95% confidence intervals (dashed gray lines).
Figure 6
Figure 6
Estimates of the V1 sampling extent for three different voxel sizes and two different field-strengths for visual areas V2-hV4 in subject S1. Increasing the voxel size from 1.63 mm3 to 2.53 mm3 and then decreasing the magnetic field-strength from 7T to 3T reveals that the connective field modeling method is robust to changing these instrumental parameters; there is noise but no bias. Error-bars indicate the 95% bootstrapped confidence intervals.

References

    1. Amano K, Wandell BA, Dumoulin SO. Visual field maps, population receptive field sizes, and visual field coverage in the human MT+ complex. Journal of Neurophysiology. 2009;102(5):2704–2718. - PMC - PubMed
    1. Andrews TJ, Halpern SD, Purves D. Correlated size variations in human visual cortex, lateral geniculate nucleus, and optic tract. The Journal of Neuroscience : The Official Journal of the Society for Neuroscience. 1997;17(8):2859–2868. - PMC - PubMed
    1. Angelucci A, Levitt JB, Walton EJ, Hupe JM, Bullier J, Lund JS. Circuits for local and global signal integration in primary visual cortex. The Journal of Neuroscience : The Official Journal of the Society for Neuroscience. 2002;22(19):8633–8646. - PMC - PubMed
    1. Arfanakis K, Cordes D, Haughton VM, Moritz CH, Quigley MA, Meyerand ME. Combining independent component analysis and correlation analysis to probe interregional connectivity in fMRI task activation datasets. Magnetic Resonance Imaging. 2000;18(8):921–930. - PubMed
    1. Bandettini PA, Jesmanowicz A, Wong EC, Hyde JS. Processing strategies for time-course data sets in functional MRI of the human brain. Magnetic Resonance in Medicine : Official Journal of the Society of Magnetic Resonance in Medicine / Society of Magnetic Resonance in Medicine. 1993;30(2):161–173. - PubMed

Publication types

LinkOut - more resources