Comparative Study
. 2012 Oct;24(10):3949-65.
doi: 10.1105/tpc.112.103010. Epub 2012 Oct 30.

Conserved noncoding sequences highlight shared components of regulatory networks in dicotyledonous plants

Affiliations
Comparative Study

Conserved noncoding sequences highlight shared components of regulatory networks in dicotyledonous plants

Laura Baxter et al. Plant Cell. 2012 Oct.

Abstract

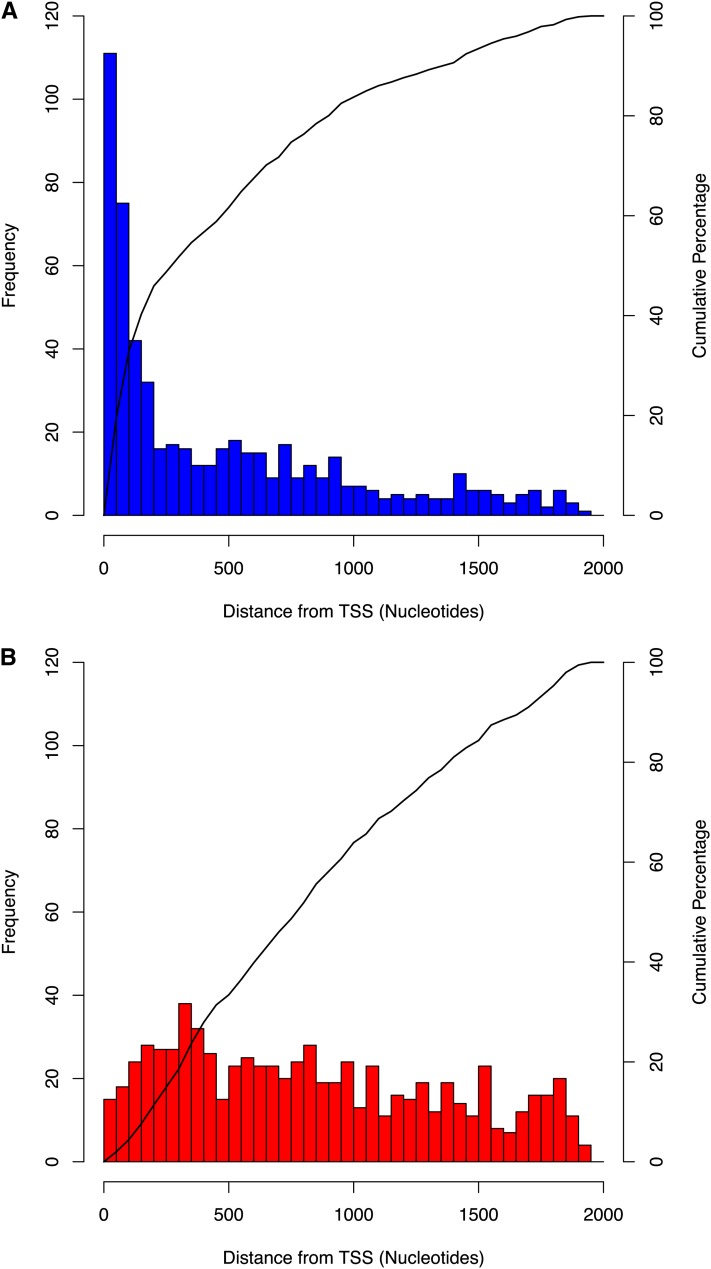
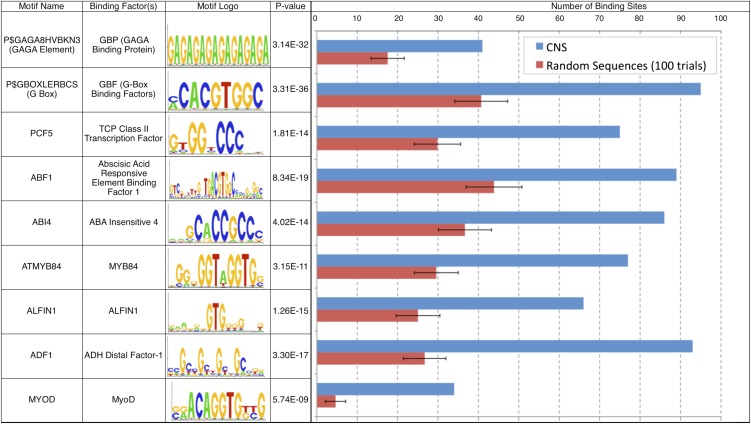
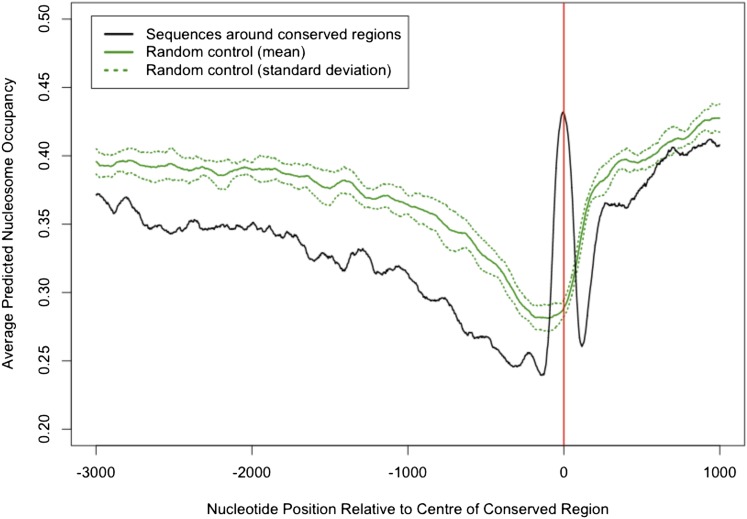
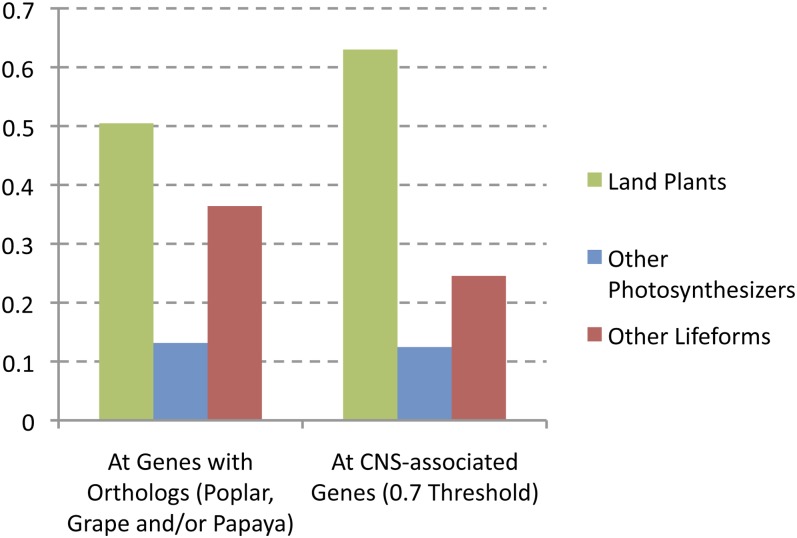
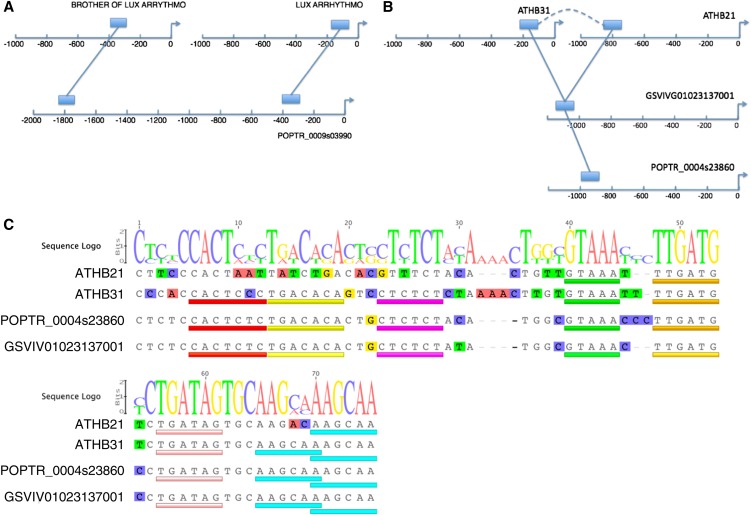
Conserved noncoding sequences (CNSs) in DNA are reliable pointers to regulatory elements controlling gene expression. Using a comparative genomics approach with four dicotyledonous plant species (Arabidopsis thaliana, papaya [Carica papaya], poplar [Populus trichocarpa], and grape [Vitis vinifera]), we detected hundreds of CNSs upstream of Arabidopsis genes. Distinct positioning, length, and enrichment for transcription factor binding sites suggest these CNSs play a functional role in transcriptional regulation. The enrichment of transcription factors within the set of genes associated with CNS is consistent with the hypothesis that together they form part of a conserved transcriptional network whose function is to regulate other transcription factors and control development. We identified a set of promoters where regulatory mechanisms are likely to be shared between the model organism Arabidopsis and other dicots, providing areas of focus for further research.


Figures

Figure 1.
Figure 1.
Alignments Produced in Orthologous Promoters Reveal a Positional Bias toward the TSS. Distribution of distances between conserved regions and the TSS in Arabidopsis promoters. Only distances where the intergenic length is at least 500 nucleotides are plotted. Distances observed in orthologous promoters, 0.7 threshold (566/602 distances plotted) (A), and randomly assigned gene pair promoters, 0.3 threshold (684/700 distances plotted) (B).
Figure 2.
Figure 2.
Arabidopsis CNSs Are Strongly Enriched for Specific TF Binding Sites. Data for selected TFBS motifs are shown. Numbers of binding site occurrences in CNSs from orthologous promoters (blue) compared with numbers in random control sequences (red; mean of 100 trials and sd shown). Sets of control sequences were picked from Arabidopsis promoter regions and match the CNS in length, number, relative position to TSS, and underrepresentation of known repetitive elements.
Figure 3.
Figure 3.
Predictions of Nucleosome Occupancy Confirm Significance of CNSs Identified. Average predicted nucleosome occupancy for 554 10-kb sequences surrounding CNSs (black line) and 10 equivalent sets of control sequences (solid green line represents mean of the 10 control sequence sets; dashed line shows sd) was calculated. The −3 kb to +1 kb regions are plotted for clarity, as values plateau either side of this for the remainder of the −5 kb to +5 kb range examined. Red line at nucleotide position 0 indicates the center position of CNS or control sequences, with TSS therefore being positioned to the right of this.
Figure 4.
Figure 4.
Genes Associated with CNSs Are More Likely to Be Land Plant Specific and Less Likely to Have Orthologs across Wider Taxonomic Distances. Histogram compares the frequency of estimated gene age groupings among genes associated with CNSs (554 genes/0.7 threshold set) with all Arabidopsis genes having an ortholog in poplar, grape, and/or papaya.
Figure 5.
Figure 5.
Analysis of CNSs Reveals Potential Subfunctionalization in Regulatory Regions of Arabidopsis Paralogs. (A) and (B) Positions of CNSs upstream of paralogous Arabidopsis genes and their orthologs. Arrows indicate TSS positions. Solid lines joining blocks indicate CNSs between orthologs, and dashed curved line in (B) indicates conservation between paralogs. (C) Alignment of CNS depicted in (B). Size of letters in the sequence logo indicates conservation of individual nucleotides. Colored bars indicate positions of potential binding sites based on alignment conservation (yellow, purple, green, and orange bars) and matches with known motifs (P300 in red, GATA in pink, and CBNAC in turquoise).
Figure 6.
Figure 6.
APPLES Software Facilitates the Analysis of Noncoding Sequences in Plant Genomes. Users can program scripts to access data from sequence and motif databases and perform sequence analyses using a range of methods. Arrows indicate a typical information flow in APPLES scripts. Technical names of some key APPLES classes are shown in blue boxes. Red boxes represent the functionality of some groups of APPLES methods.

References

    1. Alabadi D., Oyama T., Yanovsky M.J., Harmon F.G., Mas P., Kay S.A. (2001). Reciprocal regulation between TOC1 and LHY/CCA1 within the Arabidopsis circadian clock. Science 293: 880–883 - PubMed
    1. Albert I., Mavrich T.N., Tomsho L.P., Qi J., Zanton S.J., Schuster S.C., Pugh B.F. (2007). Translational and rotational settings of H2A.Z nucleosomes across the Saccharomyces cerevisiae genome. Nature 446: 572–576 - PubMed
    1. Altschul S.F., Gish W., Miller W., Myers E.W., Lipman D.J. (1990). Basic local alignment search tool. J. Mol. Biol. 215: 403–410 - PubMed
    1. Arabidopsis Genome Initiative (2000). Analysis of the genome sequence of the flowering plant Arabidopsis thaliana. Nature 408: 796–815 - PubMed
    1. Arnosti D.N., Kulkarni M.M. (2005). Transcriptional enhancers: Intelligent enhanceosomes or flexible billboards? J. Cell. Biochem. 94: 890–898 - PubMed

Publication types