

doi: 10.1039/c2cc36540e.
Epub 2012 Oct 31.
PNA-based microRNA inhibitors elicit anti-inflammatory effects in microglia cells
Affiliations
- PMID: 23111503
- PMCID: PMC3593954
- DOI: 10.1039/c2cc36540e
Item in Clipboard
PNA-based microRNA inhibitors elicit anti-inflammatory effects in microglia cells
Chem Commun (Camb).
.
Abstract
Peptide nucleic acid (PNA) inhibitors of miR-221-3p (CU-PNA-221) and miR-466l-3p (CU-PNA-466) demonstrated changes in inflammatory responses. Suppression of inflammatory signalling was unexpected and further investigation led to the identification of calmodulin as a novel target of miRNA-466l-3p. These studies demonstrate that exogenous agents may suppress neuroinflammation mediated by microglial cells.
Figures
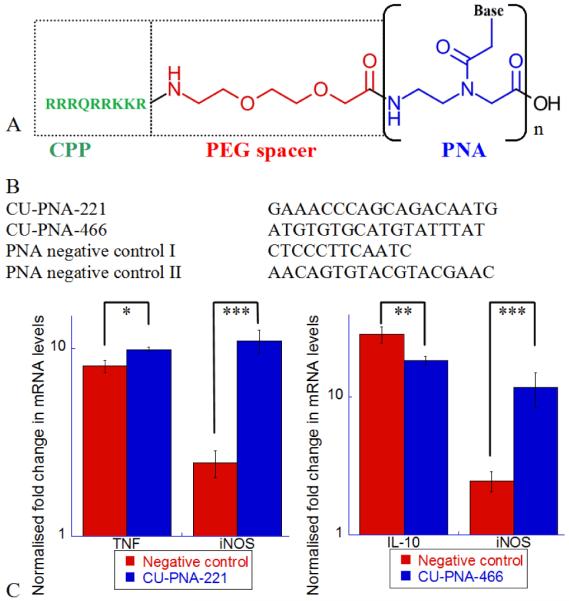
PNA inhibitors and their effects on BV-2 microglia cells as analysed by quantitative real time polymerase chain reaction (qPCR). (A) The structure of a PNA miRNA inhibitor. The cell penetrating peptide (CPP, in green) used to facilitate passage across the cell plasma membranes. The PEG spacer (in red) separates the CPP from the PNA subunit (in blue). The PNA subunit presents complementary sequences for the miRNA of interest. (B) The sequences of the four PNA miRNA inhibitors used in this work. These represent the PNA sequence of the repeated subunit represented in Fig. 1A. (C) Left: The effects of CUPNA-221 upon TNF and iNOS mRNA 2 and 6 hours respectively, after a 400 ng ml−1 LPS challenge. Right: The effects of CU-PNA-466 upon IL-10 and iNOS mRNA 2 and 6 hours after an LPS challenge. Both these graphs are presented on a log scale with P-values represented as follows *<0.025, **<0.010 and, ***<0.005.
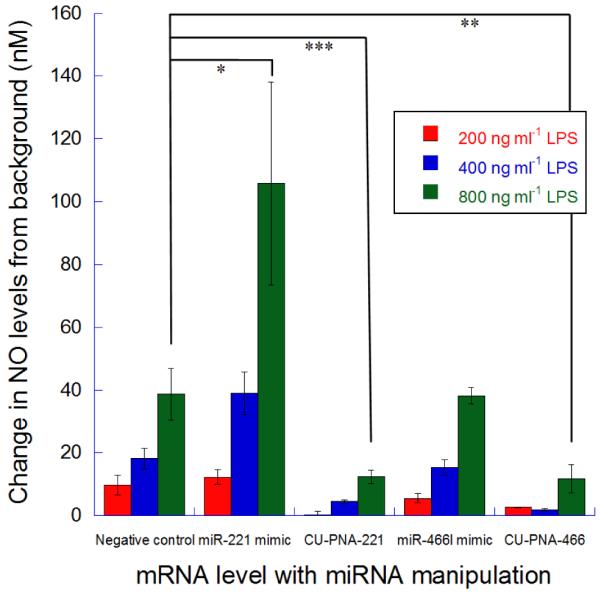
Changes in release of NO from BV-2 microglia cells upon miRNA modulation. The change in NO release levels from BV-2 cells under LPS stimulation (200, 400 and 800 ng ml−1) with miR-221-3p or miR-466l-3p modulations. These signals are normalised to the signal from cells treated with no LPS and are all taken after a 24 hour incubation. P-values represented as follows *<0.025, **<0.010 and, ***<0.005.
Similar articles
-
Benfotiamine attenuates inflammatory response in LPS stimulated BV-2 microglia.PLoS One. 2015 Feb 19;10(2):e0118372. doi: 10.1371/journal.pone.0118372. eCollection 2015. PLoS One. 2015. PMID: 25695433 Free PMC article.
-
Anti-Inflammatory and Anti-Migratory Activities of Isoquinoline-1-Carboxamide Derivatives in LPS-Treated BV2 Microglial Cells via Inhibition of MAPKs/NF-κB Pathway.Int J Mol Sci. 2020 Mar 27;21(7):2319. doi: 10.3390/ijms21072319. Int J Mol Sci. 2020. PMID: 32230861 Free PMC article.
-
Modelling neuroinflammation in vitro: a tool to test the potential neuroprotective effect of anti-inflammatory agents.PLoS One. 2012;7(9):e45227. doi: 10.1371/journal.pone.0045227. Epub 2012 Sep 20. PLoS One. 2012. PMID: 23028862 Free PMC article.
-
Anti-inflammatory mechanisms of N-adamantyl-4-methylthiazol-2-amine in lipopolysaccharide-stimulated BV-2 microglial cells.Int Immunopharmacol. 2014 Sep;22(1):73-83. doi: 10.1016/j.intimp.2014.06.022. Epub 2014 Jun 25. Int Immunopharmacol. 2014. PMID: 24975832
-
Inhibition of neuroinflammation by thymoquinone requires activation of Nrf2/ARE signalling.Int Immunopharmacol. 2017 Jul;48:17-29. doi: 10.1016/j.intimp.2017.04.018. Epub 2017 May 3. Int Immunopharmacol. 2017. PMID: 28458100
Cited by
-
Inhibition of MicroRNA-221 Alleviates Neuropathic Pain Through Targeting Suppressor of Cytokine Signaling 1.J Mol Neurosci. 2016 Jul;59(3):411-20. doi: 10.1007/s12031-016-0748-1. Epub 2016 Apr 8. J Mol Neurosci. 2016. PMID: 27059231
-
Balancing the immune response in the brain: IL-10 and its regulation.J Neuroinflammation. 2016 Nov 24;13(1):297. doi: 10.1186/s12974-016-0763-8. J Neuroinflammation. 2016. PMID: 27881137 Free PMC article. Review.
-
Targeting miR‑155‑5p and miR‑221‑3p by peptide nucleic acids induces caspase‑3 activation and apoptosis in temozolomide‑resistant T98G glioma cells.Int J Oncol. 2019 Jul;55(1):59-68. doi: 10.3892/ijo.2019.4810. Epub 2019 May 23. Int J Oncol. 2019. PMID: 31180529 Free PMC article.
-
Synthesis of PNA oligoether conjugates.Molecules. 2014 Mar 13;19(3):3135-48. doi: 10.3390/molecules19033135. Molecules. 2014. PMID: 24633349 Free PMC article.
-
Synergistic effects of the combined treatment of U251 and T98G glioma cells with an anti‑tubulin tetrahydrothieno[2,3‑c]pyridine derivative and a peptide nucleic acid targeting miR‑221‑3p.Int J Oncol. 2021 Aug;59(2):61. doi: 10.3892/ijo.2021.5241. Epub 2021 Jul 19. Int J Oncol. 2021. PMID: 34278445 Free PMC article.
References
Publication types
MeSH terms
Substances
Grants and funding
LinkOut - more resources
Full Text Sources
Other Literature Sources