. 2012 Nov 13;109(46):E3196-205.
doi: 10.1073/pnas.1206004109. Epub 2012 Oct 29.

CDX2 is an amplified lineage-survival oncogene in colorectal cancer

Affiliations

CDX2 is an amplified lineage-survival oncogene in colorectal cancer

Keyan Salari et al. Proc Natl Acad Sci U S A. .

Abstract

The mutational activation of oncogenes drives cancer development and progression. Classic oncogenes, such as MYC and RAS, are active across many different cancer types. In contrast, "lineage-survival" oncogenes represent a distinct and emerging class typically comprising transcriptional regulators of a specific cell lineage that, when deregulated, support the proliferation and survival of cancers derived from that lineage. Here, in a large collection of colorectal cancer cell lines and tumors, we identify recurrent amplification of chromosome 13, an alteration highly restricted to colorectal-derived cancers. A minimal region of amplification on 13q12.2 pinpoints caudal type homeobox transcription factor 2 (CDX2), a regulator of normal intestinal lineage development and differentiation, as a target of the amplification. In contrast to its described role as a colorectal tumor suppressor, CDX2 when amplified is required for the proliferation and survival of colorectal cancer cells. Further, transcriptional profiling, binding-site analysis, and functional studies link CDX2 to Wnt/β-catenin signaling, itself a key oncogenic pathway in colorectal cancer. These data characterize CDX2 as a lineage-survival oncogene deregulated in colorectal cancer. Our findings challenge a prevailing view that CDX2 is a tumor suppressor in colorectal cancer and uncover an additional piece in the multistep model of colorectal tumorigenesis.


Conflict of interest statement

The authors declare no conflict of interest.

Figures

Fig. 1.
Fig. 1.
Recurrent amplification and overexpression of CDX2 in colorectal cancer cell lines and primary tumors. (A) Peaks of recurrent amplification among 29 colorectal cancer cell lines. The G-score is shown on the upper x-axis, and the q-value is shown on the lower x-axis for recurrent amplifications across the genome (y-axis) identified by GISTIC analysis of aCGH data. The positions of the most significant recurrent amplifications are labeled on the right. The green line indicates a false discovery rate of 0.25. (B) Heatmaps of the 10-Mb region of chromosome segment 13q12.2 displaying the minimal region of amplification in 29 colorectal cancer cell lines (Left) and 226 primary colorectal tumors (Right; only the amplified subset of samples is shown). Each sample is represented by a column in which areas of genomic amplification and deletion are depicted in red and blue, respectively. Alongside are graphs of the corresponding GISTIC q-value, defining the amplicon peak. The positions of CDX2 and CDK8 are indicated by dashed lines. Asterisks indicate samples excluding CDK8 from the minimal region of amplification; the hash symbol (#) marks the one sample including CDK8 that excludes CDX2. (C) High-resolution mapping of the 13q12.2 amplicon in COLO320 using an Affymetrix SNP 6.0 array. Log2 copy number ratios plotted on the y-axis indicate the boundaries of the focal region of amplification spanning two RefSeq genes, PDX1 and CDX2. The position of candidate colorectal oncogene CDK8 outside the region of amplification is indicated. (D) Western blot analysis of CDX2 protein expression in 11 colorectal cancer cell lines with and without 13q12.2 amplification, including one line with single-copy loss of 13q (SW837). Shown are short and long exposures using an anti-CDX2 antibody; GAPDH serves as a loading control. Relative CDX2 expression levels are indicated, normalized to GAPDH and referenced to SW620 (set to 1). Note: SW480 and SW620 are matched primary and metastasis-derived lines from the same patient; the absence of 13q gain in SW620 and the relatively low CDX2 expression in both lines suggest that 13q gain is not a driving event for this tumor.
Fig. 2.
Fig. 2.
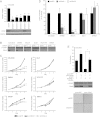
RNAi of CDX2 inhibits proliferation and anchorage-independent growth of CDX2-amplified cell lines. (A) Cell viability upon stable knockdown of CDX2 expression by five independent shRNA constructs relative to shGFP in COLO320 cells. Mean cell viabilities (±1 SD), assayed 5 d after plating cells, are reported. Hash symbols (#) indicate the two CDX2-directed shRNA constructs used in subsequent experiments. Western blot of CDX2 and GAPDH are shown. ***P < 0.001 (Student t test, shCDX2 compared with shGFP). Note that shCDX2-4 is not associated with substantial CDX2 knockdown, and therefore reduced viability likely reflects an off-target effect; that shRNA is not used in subsequent studies. (B) Western blot analysis of six colorectal cancer cell lines stably expressing shRNA constructs targeting CDX2 or GFP (shCDX2-1, shCDX2-3, and shGFP). α-Tubulin serves as a loading control. COLO320, SW948, and SKCO1 bear 13q12.2 amplification; DLD1, NCI-H747, and SW837 do not. (C) Effects of CDX2 knockdown on cell viability over 5 d. Data are normalized to day 1 values to correct for differences in cell plating. Mean cell viabilities (±1 SD) of representative experiments done twice in triplicate are reported. *P < 0.05, **P < 0.01, ***P < 0.001. (D) Colony formation in soft agar of colorectal cancer cell lines with and without 13q12.2 gain/amplification reported as percentage relative to shGFP (±1 SD). **P < 0.01, ***P < 0.001. (E) Soft agar colony formation of COLO320 cells coinfected to express stably shCDX2-1 or shGFP with CDX2 or control RFP vector. Western blot of CDX2 and α-tubulin and representative images of soft agar colonies are shown. Colony formation is reported as percentage relative to cells expressing shGFP and RFP vector (±1 SD). **P < 0.01.
Fig. 3.
Fig. 3.
CDX2 promotes expression of Wnt/β-catenin pathway genes. (A) Pathways significantly enriched among differentially expressed genes in COLO320 cells after transfection with either of two CDX2-targeting siRNA constructs (siCDX2-1 or siCDX2-3) compared with an NTC siRNA construct. The satistical significance of enriched gene sets is indicated on the x-axis as the −log10 of the hypergeometric P value. (B) Gene expression of Wnt-signaling gene set members down-regulated upon transient CDX2 knockdown. Log2 mRNA fluorescence ratios between cells transfected with CDX2-targeting or NTC siRNA constructs are shown. Data are reported as the average of microarray experiments assessing transcript abundance by the two independent siCDX2 constructs. (C) Sequence conservation of CDX2 ChIP-seq binding regions. Score indicating conservation across multiple vertebrate species is shown on the y axis for all CDX2 ChIP-seq binding regions analyzed in aggregate. Scores are reported relative to the center of CDX2 ChIP regions. (D) Sequence logos of CDX2-binding motifs. (Left) The motif identified de novo from CDX2 ChIP-seq binding peaks in COLO320 cells. (Right) A CDX2 motif previously defined in vitro by protein-binding microarrays (PBM). (E) CDX2 ChIP-seq binding peaks within and near the known intestine-specific CDX2 target gene sucrase-isomaltase and newly identified targets WNT5A, TCF4, and LEF1. Normalized enrichment of CDX2-immunoprecipitated chromatin over input DNA is shown on the y-axis, and genomic coordinates are labeled on upper x-axis. Gene structure is indicated above each plot. (F) Sequence logos of significantly enriched transcription factor-binding motifs within 100 bp of CDX2 ChIP-seq binding peaks in COLO320 cells.
Fig. 4.
Fig. 4.
CDX2 regulates β-catenin transcriptional activity. β-Catenin/TCF-dependent transcriptional activity measured 24 h after transfection with a β-catenin/TCF-luciferase (TOPflash) or mutant control-luciferase (FOPflash) reporter construct in (A) 13q12.2-amplified cell lines COLO320 and SKCO1 and (B) nonamplified cell lines DLD1 and SW837 stably expressing CDX2- or GFP-targeting shRNA constructs. Mean (±1 SD) luciferase activity is reported relative to shGFP. **P < 0.01, ***P < 0.001. (C) Representative colorectal cancer specimen from a TMA of 76 evaluable cases showing tumor nuclei with positive immunostaining of CDX2 (Left) and β-catenin (Right). Arrowheads identify representative cells showing nuclear β-catenin staining. (Scale bars, 50 µm.)
Fig. P1.
Fig. P1.
CDX2 is frequently amplified in colorectal cancer, where it promotes Wnt/β-catenin signaling. (Upper) Plot of significant DNA amplifications in colorectal cancers reveals amplification on chromosome 13 pinpointing CDX2. (Lower) Schematic model summarizing data indicating that CDX2, when amplified, promotes Wnt/β-catenin signaling by regulating transcript levels of Wnt signaling pathway genes (Left) and by enhancing expression of Wnt pathway target genes by β-catenin (Right).

References

    1. American Cancer Society (2011) Cancer Facts & Figures 2011 (American Cancer Society, Atlanta)
    1. Vogelstein B, et al. Genetic alterations during colorectal-tumor development. N Engl J Med. 1988;319(9):525–532. - PubMed
    1. Lengauer C, Kinzler KW, Vogelstein B. Genetic instability in colorectal cancers. Nature. 1997;386(6625):623–627. - PubMed
    1. Walther A, Houlston R, Tomlinson I. Association between chromosomal instability and prognosis in colorectal cancer: A meta-analysis. Gut. 2008;57(7):941–950. - PubMed
    1. Popat S, Houlston RS. A systematic review and meta-analysis of the relationship between chromosome 18q genotype, DCC status and colorectal cancer prognosis. Eur J Cancer. 2005;41(14):2060–2070. - PubMed

Publication types

MeSH terms

Associated data