. 2012 Nov 13;109(46):18833-8.
doi: 10.1073/pnas.1209277109. Epub 2012 Oct 29.

Interactions of subunit CCT3 in the yeast chaperonin CCT/TRiC with Q/N-rich proteins revealed by high-throughput microscopy analysis

Affiliations

Interactions of subunit CCT3 in the yeast chaperonin CCT/TRiC with Q/N-rich proteins revealed by high-throughput microscopy analysis

Michal Nadler-Holly et al. Proc Natl Acad Sci U S A. .

Abstract

The eukaryotic chaperonin containing t-complex polypeptide 1 (CCT/TRiC) is an ATP-fueled machine that assists protein folding. It consists of two back-to-back stacked rings formed by eight different subunits that are arranged in a fixed permutation. The different subunits of CCT are believed to possess unique substrate binding specificities that are still mostly unknown. Here, we used high-throughput microscopy analysis of yeast cells to determine changes in protein levels and localization as a result of a Glu to Asp mutation in the ATP binding site of subunits 3 (CCT3) or 6 (CCT6). The mutation in subunit CCT3 was found to induce cytoplasmic foci termed P-bodies where mRNAs, which are not translated, accumulate and can be degraded. Analysis of the changes in protein levels and structural modeling indicate that P-body formation in cells with the mutation in CCT3 is linked to the specific interaction of this subunit with Gln/Asn-rich segments that are enriched in many P-body proteins. An in vitro gel-shift analysis was used to show that the mutation in subunit CCT3 interferes with the ability of CCT to bind a Gln/Asn-rich protein aggregate. More generally, the strategy used in this work can be used to unravel the substrate specificities of other chaperone systems.


Conflict of interest statement

The authors declare no conflict of interest.

Figures

Fig. 1.
Fig. 1.
Scheme showing the approach put forward in this work for screening effects of mutations in CCT on substrate folding and localization. (A) The mutation in the ATP binding sites of subunits CCT3 or CCT6 (in red) can interfere with substrate binding and cause misfolding. Substrates can also misfold after binding to the mutant CCT or be released only partially. Misfolding can lead to aggregation or degradation that may be reflected in changes in protein levels and/or localization. (B) Strains with the mutation in CCT were crossed with a library of strains expressing endogenous yeast proteins fused to GFP. The resulting strains, each expressing wild-type (control) or mutant CCT and an endogenous yeast protein fused to GFP, were subjected to high-throughput microscopy screening to determine changes in protein levels and localization.
Fig. 2.
Fig. 2.
P-bodies are formed in strains with the mutation in the ATP binding site of subunit CCT3. (A) P-body proteins (Lsm2, Lsm3, Pat1, Kem1, Dcp1, Dcp2, Nmd4, and Nam7) form much more pronounced puncta in the MA3 strain relative to the MA6 and wild-type strains. (B) Colocalization experiments were carried out by transforming the strains in A with a plasmid expressing the P-body marker, Edc3-mCherry. A perfect merge between the GFP-tagged P-body proteins and the Edc3-mCherry protein is observed, indicating that the puncta are bona fide P-bodies. (Scale bars, 5 μm.)
Fig. 3.
Fig. 3.
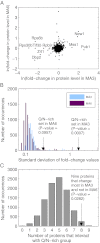
Levels of Q/N-rich proteins and their interaction partners change more in MA3 than in MA6 cells. (A) The natural logarithms of the fold change values of protein levels in MA6 are plotted against those of the corresponding proteins in MA3. The proteins whose levels in MA3 increase or decrease by a factor of 3 or more (relative to wild-type) and in MA6 by a factor of less than 3 (relative to MA3) are designated. (B) The SDs of the fold change values for the list of Q/N-rich proteins (compiled in ref. 25) are calculated for MA3 and MA6 (arrows) and compared with the SDs of 104 groups of the same size that contain randomly selected proteins that are not included in the list of Q/N-rich proteins. (C) Eight of the nine proteins in A are found to have at least one physical or genetic interaction with Q/N-rich proteins (arrow), whereas in randomly chosen groups of nine proteins only four to five proteins, on average, have physical or genetic interactions with Q/N-rich proteins.
Fig. 4.
Fig. 4.
Mapping of anchoring spots for Q/N on the surfaces of the apical domain of GroEL (Left) and CCT3 (Center and Right). The solvent accessible surfaces of the apical domains of CCT3 (26) and GroEL (27) are shown with the substrate binding sites highlighted in brown. The terminal CH2CO(NH2) groups of the anchors with ΔG ≤ −4 kcal/mol are shown, with the C, N and O atoms in green, blue, and red, respectively. Arrows in Center highlight two stretches of approximately equally spaced anchors. (Right) A model of a poly-Q β-strand bound to CCT3 and occupying the long stretch of anchoring sites. Figure prepared with Chimera software (33, 34).
Fig. 5.
Fig. 5.
Graphical representation of the most Q/N-rich segments of seven residues in the proteins that aggregate or whose levels increase or decrease by a factor of two in the MA3 and MA6 strains. Light gray, dark gray, and black designate Q, N, and all other residues, respectively.
Fig. 6.
Fig. 6.
Plot of fraction of aggregate-bound CCT as a function of amount of aggregate added. Equal concentrations of wild-type or mutant CCT were added to increasing amounts of cell extract containing aggregates of Lsm4-EYFP. The ratio of [bound CCT]/[total CCT] is plotted against the amount of aggregate added. (Inset) Result of a representative Western blot in the case of CCT with the mutation in CCT6.
Fig. 7.
Fig. 7.
Q/N-rich proteins are more common in yeast than in E. coli. The histogram shows the frequencies of proteins in yeast (dark gray) and E. coli (light gray) with different fractions of Q/N (the number of Q/N residues in a protein divided by its total number of residues). The sequences were taken from UniProt.

Similar articles

Cited by

References

    1. Horwich AL, Fenton WA, Chapman E, Farr GW. Two families of chaperonin: physiology and mechanism. Annu Rev Cell Dev Biol. 2007;23:115–145. - PubMed
    1. Yébenes H, Mesa P, Muñoz IG, Montoya G, Valpuesta JM. Chaperonins: two rings for folding. Trends Biochem Sci. 2011;36(8):424–432. - PubMed
    1. Azia A, Unger R, Horovitz A. What distinguishes GroEL substrates from other Escherichia coli proteins? FEBS J. 2012;279(4):543–550. - PubMed
    1. Gao Y, Thomas JO, Chow RL, Lee GH, Cowan NJ. A cytoplasmic chaperonin that catalyzes β-actin folding. Cell. 1992;69(6):1043–1050. - PubMed
    1. Yaffe MB, et al. TCP1 complex is a molecular chaperone in tubulin biogenesis. Nature. 1992;358(6383):245–248. - PubMed

Publication types

MeSH terms

LinkOut - more resources