. 2012 Oct 29:3:236.
doi: 10.3389/fpls.2012.00236. eCollection 2012.

Evidence for a Contribution of ALA Synthesis to Plastid-To-Nucleus Signaling

Affiliations

Evidence for a Contribution of ALA Synthesis to Plastid-To-Nucleus Signaling

Olaf Czarnecki et al. Front Plant Sci. .

Abstract

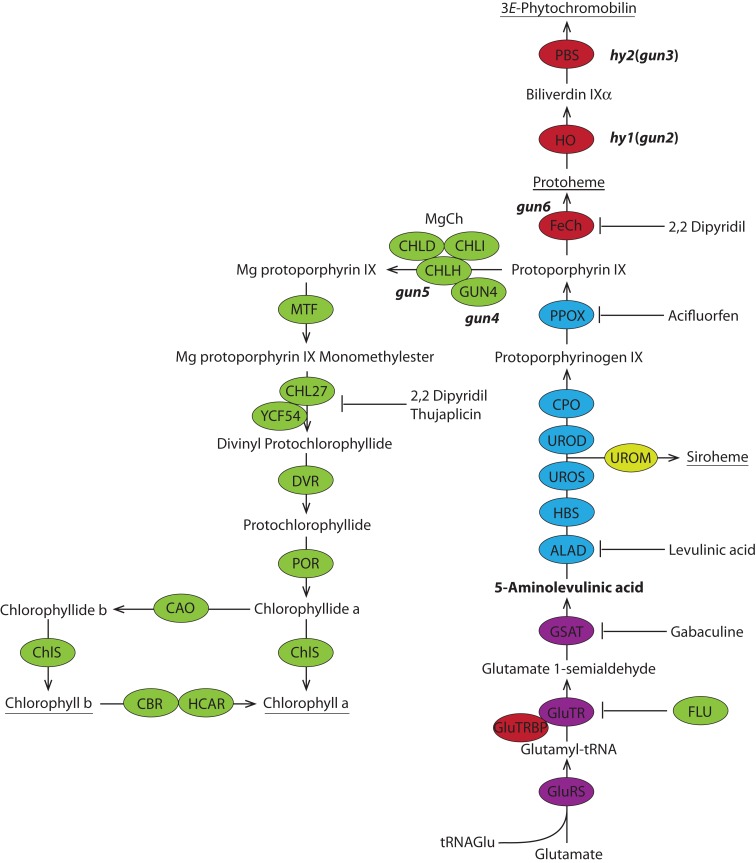
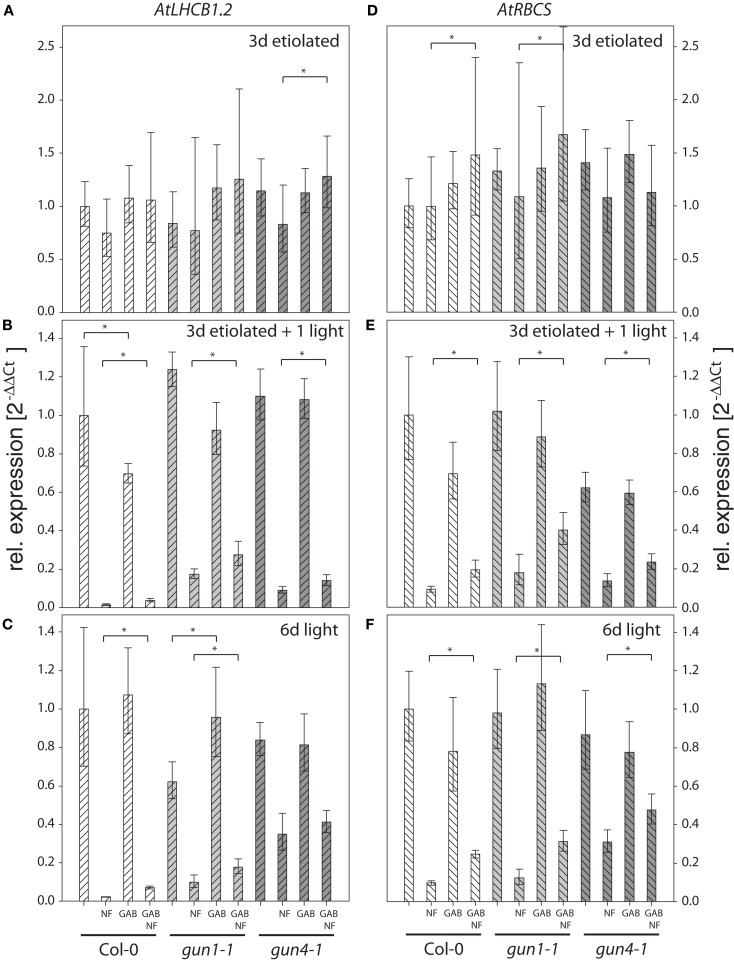
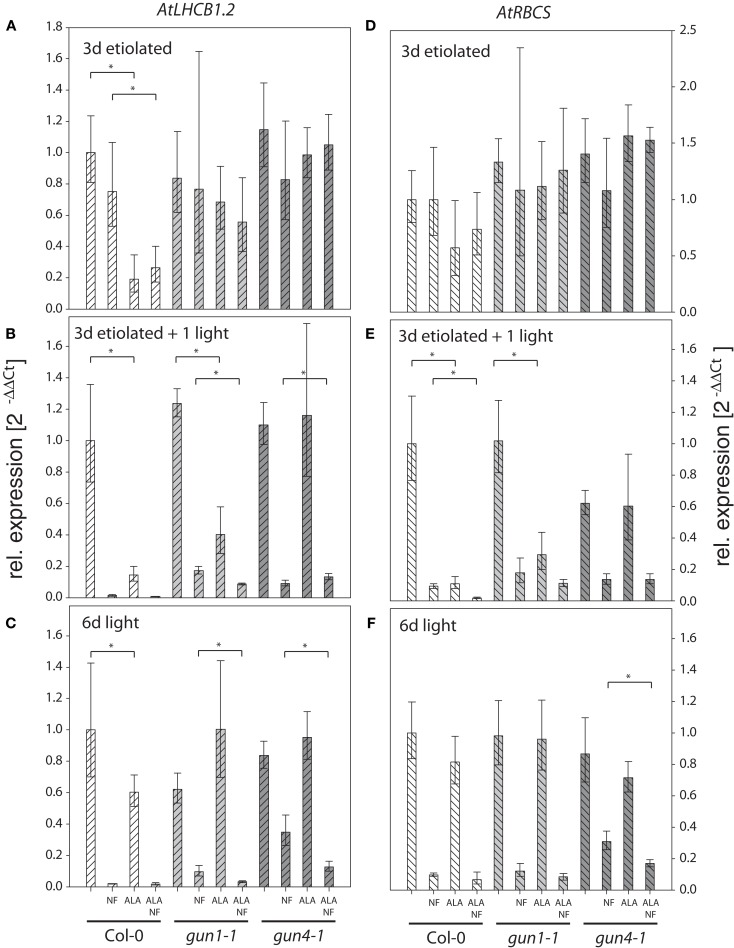
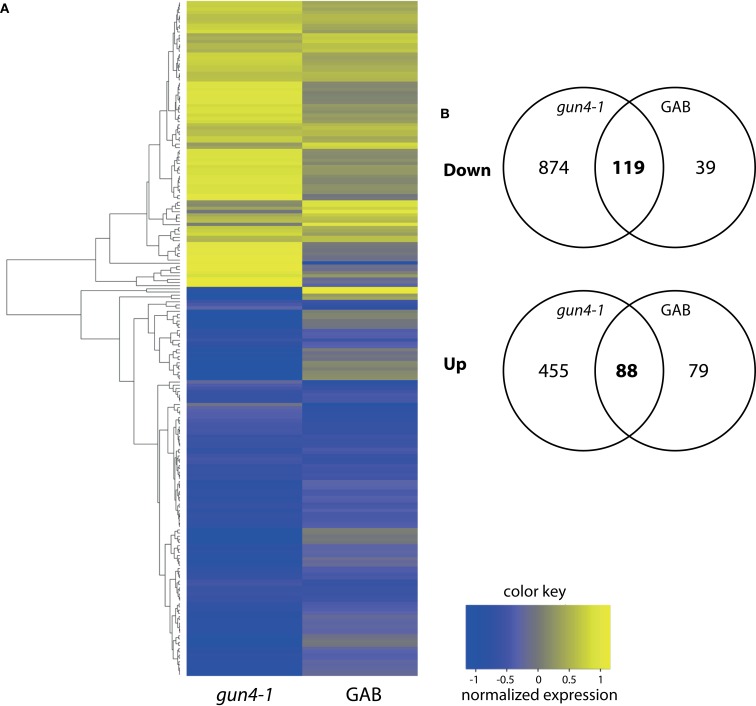
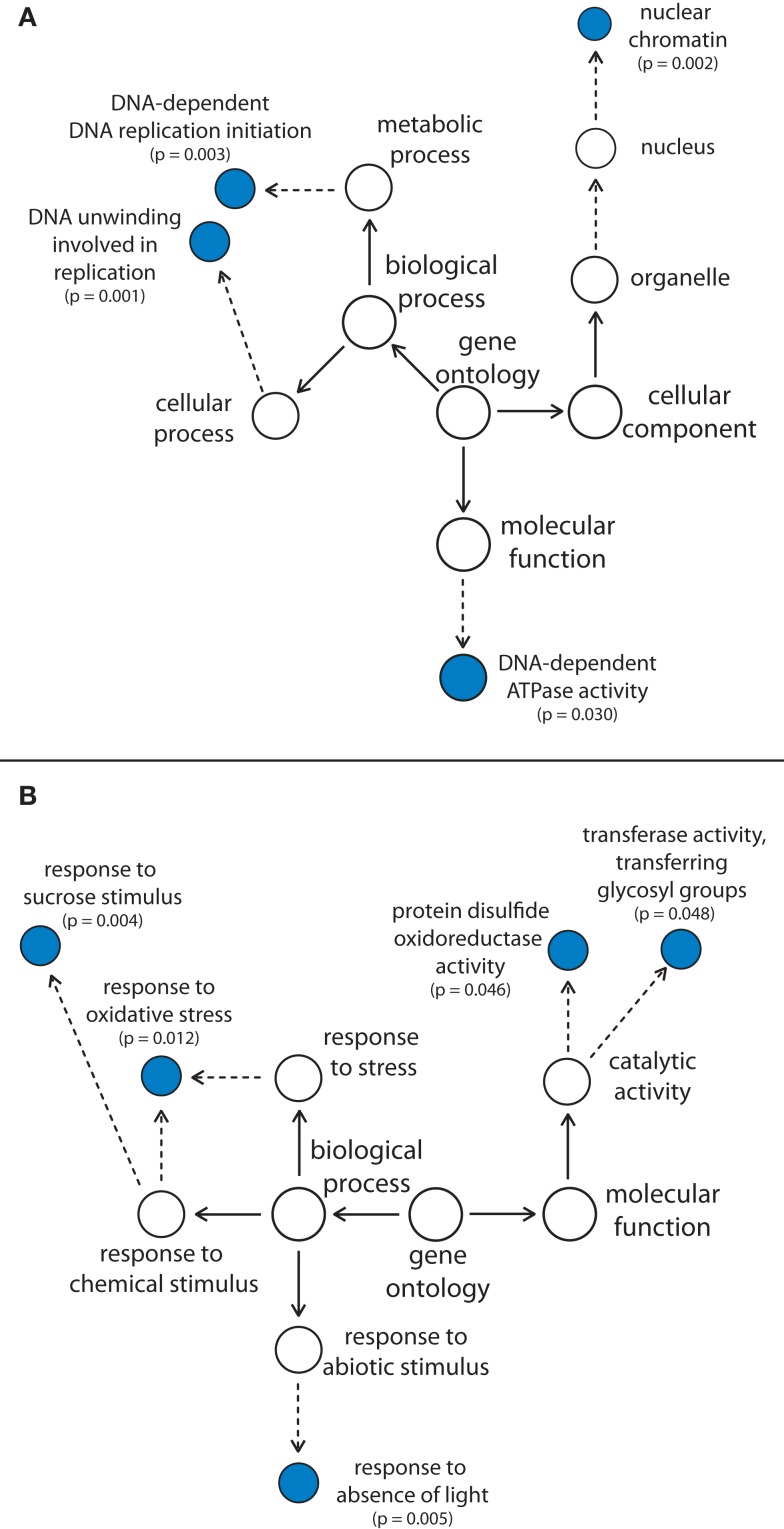
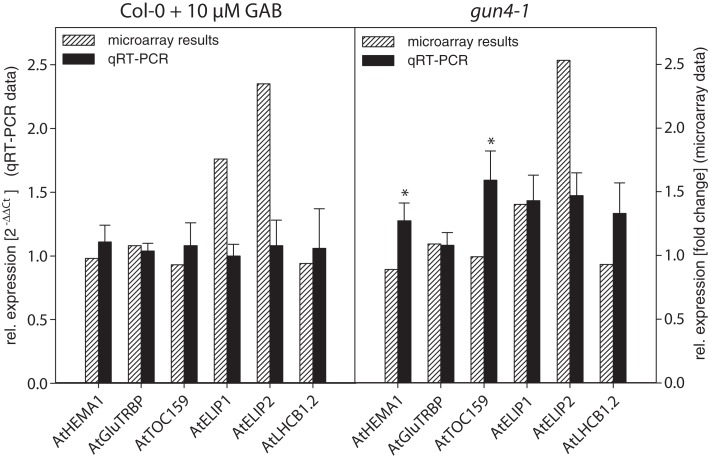
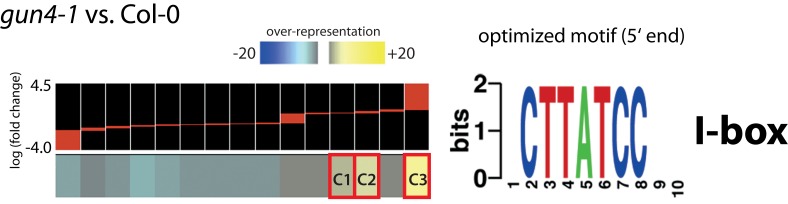
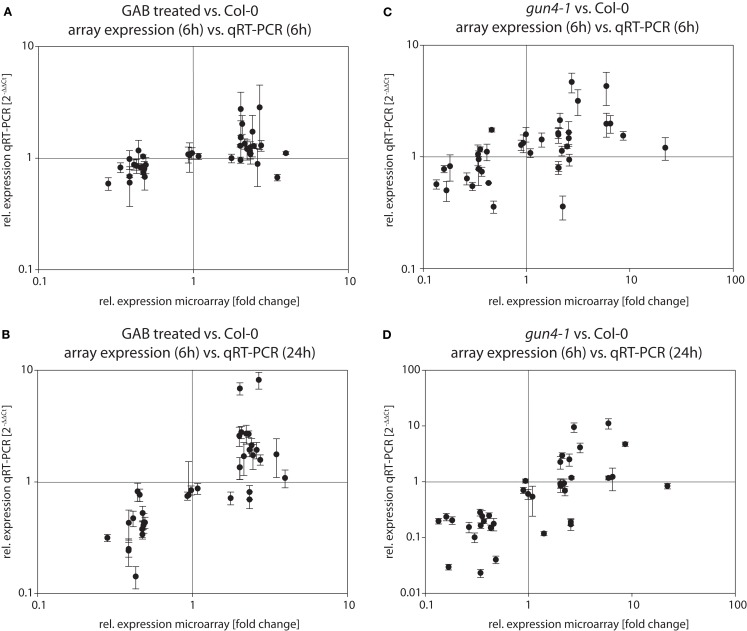
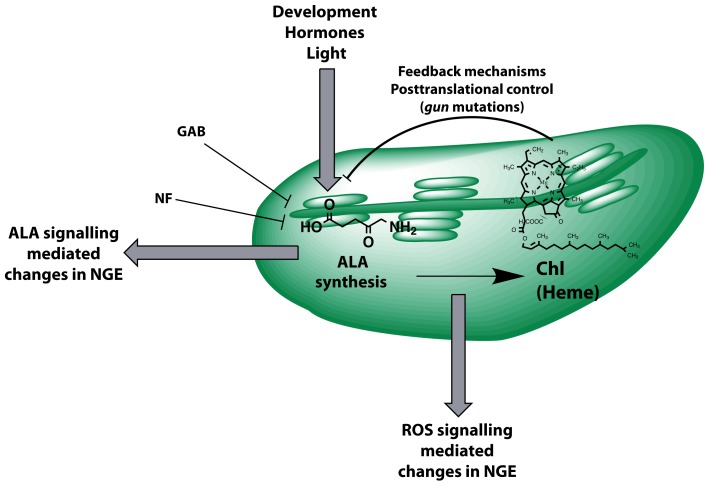
The formation of 5-aminolevulinic acid (ALA) in tetrapyrrole biosynthesis is widely controlled by environmental and metabolic feedback cues that determine the influx into the entire metabolic path. Because of its central role as the rate-limiting step, we hypothesized a potential role of ALA biosynthesis in tetrapyrrole-mediated retrograde signaling and exploited the direct impact of ALA biosynthesis on nuclear gene expression (NGE) by using two different approaches. Firstly, the Arabidopsisgun1, hy1 (gun2), hy2 (gun3), gun4 mutants showing uncoupled NGE from the physiological state of chloroplasts were thoroughly examined for regulatory modifications of ALA synthesis and transcriptional control in the nucleus. We found that reduced ALA-synthesizing capacity is common to analyzed gun mutants. Inhibition of ALA synthesis by gabaculine (GAB) that inactivates glutamate-1-semialdehyde aminotransferase and ALA feeding of wild-type and mutant seedlings corroborate the expression data of gun mutants. Transcript level of photosynthetic marker genes were enhanced in norflurazon (NF)-treated seedlings upon additional GAB treatment, while enhanced ALA amounts diminish these RNA levels in NF-treated wild-type in comparison to the solely NF-treated seedlings. Secondly, the impact of posttranslationally down-regulated ALA synthesis on NGE was investigated by global transcriptome analysis of GAB-treated Arabidopsis seedlings and the gun4-1 mutant, which is also characterized by reduced ALA formation. A common set of significantly modulated genes was identified indicating ALA synthesis as a potential signal emitter. The over-represented gene ontology categories of genes with decreased or increased transcript abundance highlight a few biological processes and cellular functions, which are remarkably affected in response to plastid-localized ALA biosynthesis. These results support the hypothesis that ALA biosynthesis correlates with retrograde signaling-mediated control of NGE.

Keywords: ALA synthesis; gabaculine; gun mutants; microarray analysis; retrograde signaling.


Figures

Figure 1
Figure 1
Metabolic pathway of tetrapyrrole biosynthesis in plants. The color code comprise the five sections of the tetrapyrrole biosynthetic pathway: ALA synthesis purple, porphyrin synthesis blue, the Fe branch red, Mg branch green, siroheme synthesis yellow. The universal precursor of all tetrapyrroles 5-aminolevulinic acid (ALA) is synthesized from glutamate via a three-step reaction. ALA is further metabolized to protoporphyrin IX before the pathway branches into heme (and phytochromobilin) and chlorophyll biosynthesis. The ratio of chlorophyll a and b is balanced in the chlorophyll cycle. The end products of the pathway are underlined. Mutants of tetrapyrrole biosynthetic enzymes that play a role in plastid-to-nucleus signaling and inhibitors of certain enzymatic steps are shown. ALAD, ALA dehydratase; CAO, Chl a oxygenase; CBR, chlorophyll b reductase; ChlS, chlorophyll synthase; CPO, coproporphyrinogen III oxidase; DVR, divinyl protochlorophyllide reductase; FeCh, Fe chelatase; FLU, flourescent; GluRS, glutamyl-tRNA synthetase; GluTR, glutamyl-tRNA reductase; GluTRBP, GluTR binding protein; GSAT, glutamate-1-semialdehyde aminotransferase; HBS, hydroxymethylbilane synthase; HCAR, 7-hydroxymethyl chlorophyll a reductase; HO, heme oxygenase; MgCh, Mg chelatase; MTF, Mg protoporphyrin IX methyltransferase; PBS, phytochromobilin synthase; POR, light dependent NADPH-protochlorophyllide oxidoreductase; PPOX, protoporphyrinogen IX oxidase; UROD, uroporphyrinogen III decarboxylase; UROM, uroporphyrinogen III methyltransferase; UROS, uroporphyrinogen III synthase.
Figure 2
Figure 2
ALA formation rate in four Arabidopsis hy1, hy2, gun1-1, and gun4-1 mutants. The ALA formation rate was determined in the leaves of 7-day-old seedlings grown on 0.5× MS medium supplemented with 1% (w/v) sucrose and given in% of the corresponding wild-type Ler-0 (light gray, 11 pmol ALA mg fw−1 h−1) or Col-0 (dark gray, 20 pmol ALA mg fw−1 h−1), respectively. Data are means of at least three biological replica ± SD. * Indicates a significant difference from wild-type at a level of P < 0.05.
Figure 3
Figure 3
Quantitative analysis of AtLHCB1.2 (A–C) and AtRBCS (D–F) transcripts in Arabidopsis seedlings fed with gabaculine (GAB) and norflurazon (NF). Seedlings of Arabidopsis wild-type Col-0, gun1-1, and gun4-1 mutants fed with or without 10 μM GAB and 1 μM NF were etiolated for 3 days (A,D), etiolated for 3 days and subsequently illuminated for 1 day (B,E), or germinated in photoperiodic light for 6 day (C,F). AtLHCB1.2 and AtRBCS expression levels were quantified by real-time PCR and calculated by the 2−ΔΔCt method using AtACT2 expression as standard. Expression data are compared to the untreated wild-type Col-0 and shown as means of at least three biological replicates ± SD. * Indicates a significant difference of pairs indicated by brackets at a level of P < 0.05. Tested were GAB-treated samples vs. untreated and GAB and NF treated vs. NF-treated samples within each genotype.
Figure 4
Figure 4
Quantitative analysis of AtLHCB1.2 (A–C) and AtRBCS (D–F) transcripts in Arabidopsis seedlings fed with 5-aminolevulinic acid (ALA) and norflurazon (NF). Seedlings of Arabidopsis wild-type Col-0, gun1-1, and gun4-1 mutants fed with or without 100 μM ALA and 1 μM NF were etiolated for 3 days (A,D), etiolated for 3 days and subsequently illuminated for 1 day (B,E), or germinated in photoperiodic light for 6 days (C,F). AtLHCB1.2 and AtRBCS expression levels were quantified by real-time PCR and calculated by the 2−ΔΔCt method using AtACT2 expression as standard. Expression data are compared to the untreated wild-type Col-0 and shown as means of at least three biological replicates ± SD. * Indicates a significant difference of pairs indicated by brackets at a level of P < 0.05. Tested were ALA treated samples vs. untreated and ALA and NF treated vs. NF-treated samples within each genotype.
Figure 5
Figure 5
(A) Heatmap analysis of differentially expressed genes in GAB-treated Arabidopsis wild-type Col-0 or gun4-1 mutants 6 h after illumination of etiolated seedlings. All genes showing a fold change of <2/3 or >3/2 and a P-value of <0.05 in both conditions were analyzed. (B) Venn diagrams summarizing changes of transcript abundance in GAB-treated Arabidopsis wild-type Col-0 or gun4-1 mutants 6 h after illumination of etiolated seedlings. The intersections of the circles represent the number of genes whose transcript abundance was decreased (“Down”) or increased (“Up”) in both compared to the untreated Arabidopsis wild-type Col-0.
Figure 6
Figure 6
Overrepresentation of gene ontology (GO) categories in genes showing decreased (A) and increased (B) transcript abundance in GAB-treated Arabidopsis wild-type Col-0 and gun4-1 mutants 6 h after illumination of etiolated seedlings. The 119 or 88 genes, respectively, being differentially regulated in both GAB-treated and gun4-1 seedlings, were analyzed for over-represented GO categories (P-value of <0.05). Dotted lines indicate intermediate categories that are not shown.
Figure 7
Figure 7
Comparison of expression data obtained by microarray analysis and qRT-PCR. RNA from GAB-treated Arabidopsis wild-type seedlings and gun4-1 mutant seedlings was extracted 6 h after light exposure of 3-day-old etiolated seedlings. In addition to microarray analysis, transcript abundance of a defined set of genes was determined by quantitative real-time PCR and calculated in relation to AtSAND expression compared to untreated Arabidopsis wild-type Col-0 seedlings [2−ΔΔCt]. qRT-PCR data are shown as average ± SD of three biological replicates. * Indicates a significant difference from the untreated Arabidopsis wild-type Col-0 (P-value of <0.05).
Figure 8
Figure 8
Identification of informative promoter sequence motifs of regulated transcripts in gun4-1 mutant seedlings compared to untreated Arabidopsis wild-type Col-0 seedlings. Columns on the left correspond to groups of genes clustered according to the similarity in their expression pattern [log (fold change)] within the microarray experiments. Clusters highlighted in red (C1, C2, and C3) show a significant over-representation of the specified motif. The sequence on the right represents the optimized motif and its name based on JASPAR, TRANSFAC, or PLACE. Names and descriptions of transcripts forming clusters C1–C3 were given in Data Sheet 3 in Supplementary Material.
Figure 9
Figure 9
Verification of microarray results via qRT-PCR. RNA from GAB-treated Arabidopsis wild-type seedlings (A,B) and gun4-1 mutant seedlings (C,D) was extracted 6 h (A,C) and 24 h (B,D), respectively, after light exposure. Transcript abundance of a defined set of genes (see Tables 2 and 3 and Table S2 in Supplementary Material) was determined by quantitative real-time PCR and calculated as relative expression [2−ΔΔCt] compared to untreated Arabidopsis wild-type Col-0 seedlings. Relative expressions obtained by qRT-PCR are plotted against relative expressions in microarray experiments (sampling 6 h after light exposure) in order to compare relative expressions in both experimental approaches.
Figure 10
Figure 10
Model summarizing control mechanisms that act on and are emitted from ALA biosynthesis. The contribution to plastid-derived retrograde signaling is highlighted. ALA formation is posttranslationally controlled by several known feedback mechanisms of the Chl and Mg branch of the pathway (e.g., heme, Mg chelatase assembly, GUN4) also reflecting the impact of the gun2-gun5 mutations on ALA synthesis. Intermediates of the tetrapyrrole biosynthetic pathway (e.g., Mg Protoporphyrin IX) were discussed to be involved in signaling pathways and likely act via reactive oxygen species (ROS)-mediated changes in nuclear gene expression (NGE). Gabaculine (GAB) directly inhibits ALA formation resulting in changes of NGE at very early stages of chloroplast development. Norflurazon (NF) inhibits tetrapyrrole biosynthesis indirectly.

Similar articles

Cited by

References

    1. Alawady A. E., Grimm B. (2005). Tobacco Mg protoporphyrin IX methyltransferase is involved in inverse activation of Mg porphyrin and protoheme synthesis. Plant J. 41, 282–29010.1111/j.1365-313X.2004.02291.x - DOI - PubMed
    1. Apel K., Hirt H. (2004). Reactive oxygen species: metabolism, oxidative stress, and signal transduction. Annu. Rev. Plant Biol. 55, 373–39910.1146/annurev.arplant.55.031903.141701 - DOI - PubMed
    1. Armstrong G. A., Runge S., Frick G., Sperling U., Apel K. (1995). Identification of NADPH:protochlorophyllide oxidoreductases A and B: a branched pathway for light-dependent chlorophyll biosynthesis in Arabidopsis thaliana. Plant Physiol. 108, 1505–151710.1104/pp.108.4.1505 - DOI - PMC - PubMed
    1. Ashburner M., Ball C. A., Blake J. A., Botstein D., Butler H., Cherry J. M., et al. (2000). Gene Ontology: tool for the unification of biology. Nat. Genet. 25, 25–2910.1038/75556 - DOI - PMC - PubMed
    1. Baier M., Dietz K. J. (2005). Chloroplasts as source and target of cellular redox regulation: a discussion on chloroplast redox signals in the context of plant physiology. J. Exp. Bot. 56, 1449–146210.1093/jxb/eri161 - DOI - PubMed