

Extremely rare interbreeding events can explain neanderthal DNA in living humans
- PMID: 23112810
- PMCID: PMC3480414
- DOI: 10.1371/journal.pone.0047076
Extremely rare interbreeding events can explain neanderthal DNA in living humans
Abstract
Considering the recent experimental discovery of Green et al that present-day non-Africans have 1 to [Formula: see text] of their nuclear DNA of Neanderthal origin, we propose here a model which is able to quantify the genetic interbreeding between two subpopulations with equal fitness, living in the same geographic region. The model consists of a solvable system of deterministic ordinary differential equations containing as a stochastic ingredient a realization of the neutral Wright-Fisher process. By simulating the stochastic part of the model we are able to apply it to the interbreeding of the African ancestors of Eurasians and Middle Eastern Neanderthal subpopulations and estimate the only parameter of the model, which is the number of individuals per generation exchanged between subpopulations. Our results indicate that the amount of Neanderthal DNA in living non-Africans can be explained with maximum probability by the exchange of a single pair of individuals between the subpopulations at each 77 generations, but larger exchange frequencies are also allowed with sizeable probability. The results are compatible with a long coexistence time of 130,000 years, a total interbreeding population of order [Formula: see text] individuals, and with all living humans being descendants of Africans both for mitochondrial DNA and Y chromosome.
Conflict of interest statement
Figures
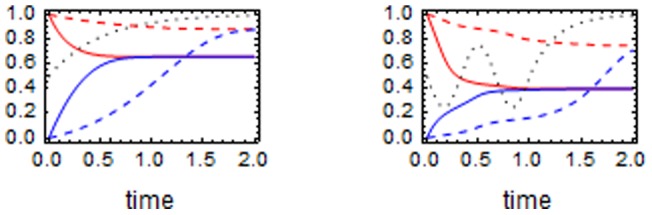
 and two different values of
  we plot the solutions of (1). In both plots, the black dotted curve represents
  . The left plot corresponds to a history in which subpopulation 2 is rapidly extinct, while the right plot to a history in which extinction of population 2 occurs after an initial period in which subpopulation sizes oscillate. In both pictures we represent a situation with
  (full lines) and another with
  (dashed lines). In each picture the upper (red) lines correspond to
  and the lower (blue) lines to
  . Notice that in these examples the allelic fractions of the subpopulations become nearly equal before extinction.
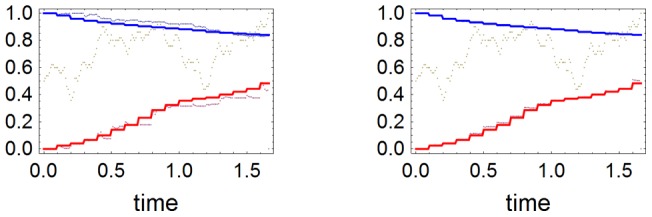
 plotted in brown dots and for
  we compare the theoretical and simulated values of
  and
and  . In both plots, the theoretical values are shown in full lines. The upper (blue) line corresponds to
  and the lower (red) line corresponds to
  .The corresponding simulated values are shown respectively as blue and red dots. The left graph shows the simulated values obtained by a single simulation, whereas the right graph shows the averages of 100 simulations.
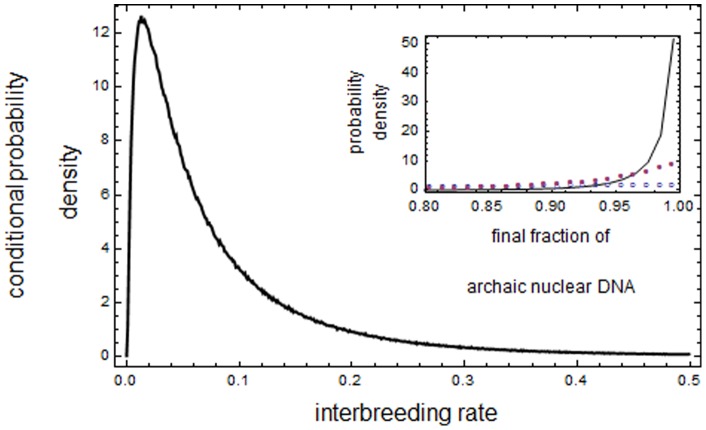
 is in the experimental interval 0.96–0.99 as a function of
  . The plot was built by obtaining one million “successful” pairs
  such that subpopulation 2 is extinct and the final value of
  – obtained by solving (1) – lies in the experimental interval. These pairs were obtained out of a total of around 140 million simulated Wright-Fisher paths
  with random
  uniformly distributed between 0 and 0.8 and
  uniformly distributed between 0 and 2. For the successful pairs we then computed the fraction associated to any given
  . In the inset we plot the probability density for the final values of
  for three different values of
  . The densities are empirically determined by simulating 400,000 Wright-Fisher paths
  with random
  uniformly distributed between 0 and 1 and selecting the histories in which subpopulation 2 is extinct. The empty dots (blue) are data for
  , the full dots (purple) are data for
  and the full curve (black) are for
  .
.
 and random
  subject to
  . From this set we selected a sample of the 790 histories in which subpopulation 2 was extinct and such that the final value of
  lied in the experimental interval. Both plots in this figure refer to this sample. In the left we show the correlation between
  and the time (in generations divided by
  ) for Neanderthal extinction. The mean extinction time in the sample is 0.58. In the right we plot the correlation between
  and
and  . Notice that the number of histories with
  in the experimental interval increases with
  , and that larger values of
  are correlated with large values of
  .
.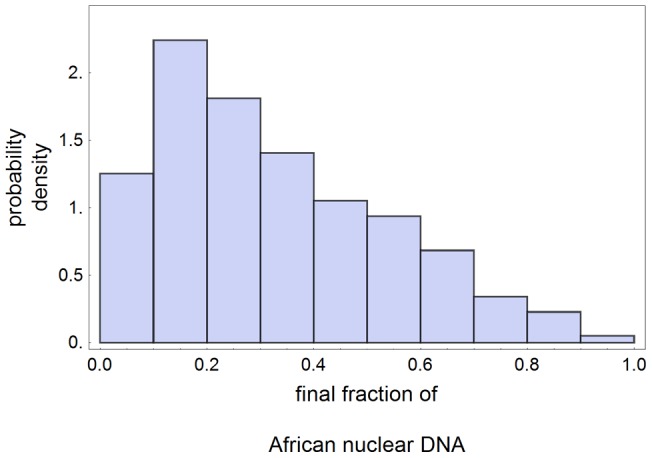
 conditioned to MEN extinction and 1 to 4% Neanderthal DNA in AAE. The mean final value of
  in the sample is 0.33.
References
-
- Cann RL, Stoneking M, Wilson AC (1987) Mitochondrial DNA and human evolution. Nature 325: 31. - PubMed
-
- Stringer C (2003) Human evolution: Out of Ethiopia. Nature 423: 692–695. - PubMed
-
- Mcbrearty S, Brooks AS (2000) The revolution that wasn’t: a new interpretation of the origin of modern human behavior. J Hum Evol 39: 453–563. - PubMed
-
- Thorne AG, Wolpoff MH (2003) The multiregional evolution of humans, revised paper. Sci Am 13. - PubMed
-
- Templeton AR (2005) Haplotype trees and modern human origins. Yearb Phys Anthropol 48: 33–59. - PubMed
Publication types
MeSH terms
Substances
LinkOut - more resources
Full Text Sources
