

Characterizing the network of drugs and their affected metabolic subpathways
- PMID: 23112813
- PMCID: PMC3480395
- DOI: 10.1371/journal.pone.0047326
Characterizing the network of drugs and their affected metabolic subpathways
Abstract
A fundamental issue in biology and medicine is illustration of the overall drug impact which is always the consequence of changes in local regions of metabolic pathways (subpathways). To gain insights into the global relationship between drugs and their affected metabolic subpathways, we constructed a drug-metabolic subpathway network (DRSN). This network included 3925 significant drug-metabolic subpathway associations representing drug dual effects. Through analyses based on network biology, we found that if drugs were linked to the same subpathways in the DRSN, they tended to share the same indications and side effects. Furthermore, if drugs shared more subpathways, they tended to share more side effects. We then calculated the association score by integrating drug-affected subpathways and disease-related subpathways to quantify the extent of the associations between each drug class and disease class. The results showed some close drug-disease associations such as sex hormone drugs and cancer suggesting drug dual effects. Surprisingly, most drugs displayed close associations with their side effects rather than their indications. To further investigate the mechanism of drug dual effects, we classified all the subpathways in the DRSN into therapeutic and non-therapeutic subpathways representing drug therapeutic effects and side effects. Compared to drug side effects, the therapeutic effects tended to work through tissue-specific genes and these genes tend to be expressed in the adrenal gland, liver and kidney; while drug side effects always occurred in the liver, bone marrow and trachea. Taken together, the DRSN could provide great insights into understanding the global relationship between drugs and metabolic subpathways.
Conflict of interest statement
Figures

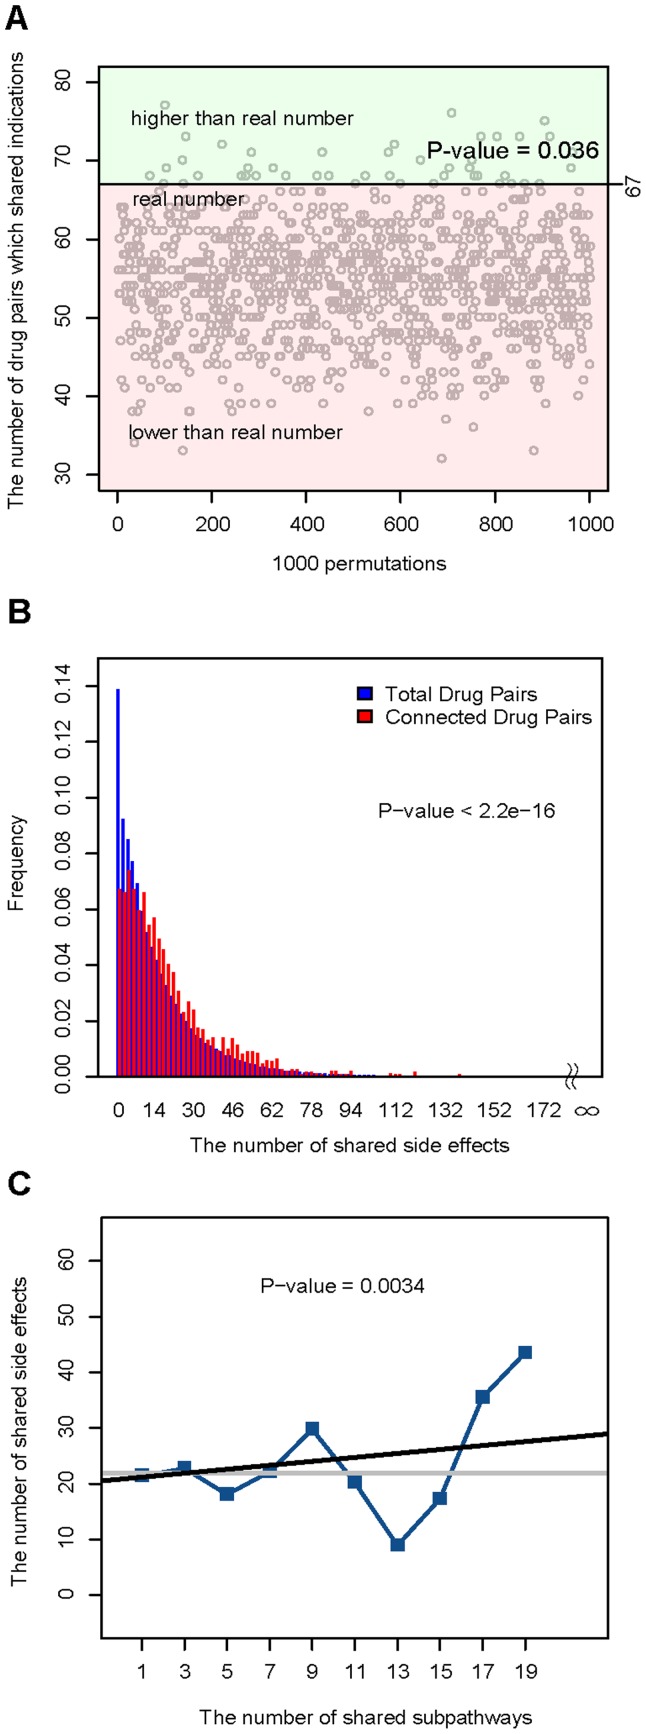
 ). (C) The number of shared side effects significantly increased as the number of the shared subpathways increased between two drugs (P-value = 0.0034). The grey horizontal line is the average number of side-effects all drug pairs shared. The Y axis represents the number of side-effects shared by drug pairs. The X axis represents the number of the same subpathways drug pairs shared. Blue “▪” symbols correspond to the binned average number of side-effects shared by drug pairs. The linear regression model (black line) is used to test the trends in correlations and the significance of the trends is estimated.
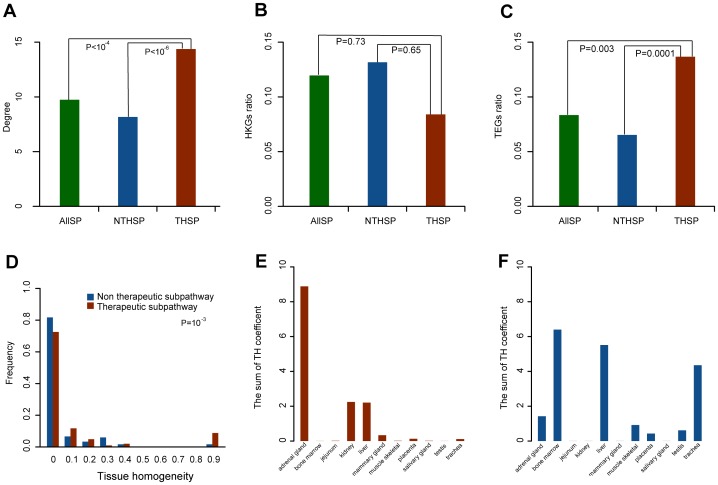
 ) and all subpathways (ALLSP) (P-value <10
 ). (B) There were no significant differences in the ratios of drug-affected HKGs between the two types of subpathway (P-value = 0.65) as well as that between therapeutic subpathways and all subpathways (P-value = 0.73). (C) The ratios of drug-affected TEGs in drug therapeutic subpathways (average ratio = 0.14) were higher than that of non-therapeutic subpathways (average ratio = 0.065; P-value = 0.0001) and that of all subpathways (average ratio = 0.08; P-value = 0.003) (D) TH coefficients of drug therapeutic subpathway were significant higher than that of non-therapeutics (P = 0.0001) (E) The sum of TH coefficients of drug therapeutic subpathways in different tissues (F) The sum of TH coefficients of drug non-therapeutic subpathways in different tissues.
References
-
- Paolini GV, Shapland RH, van Hoorn WP, Mason JS, Hopkins AL (2006) Global mapping of pharmacological space. Nat Biotechnol 24: 805–815. - PubMed
-
- Scheiber J, Chen B, Milik M, Sukuru SC, Bender A, et al. (2009) Gaining insight into off-target mediated effects of drug candidates with a comprehensive systems chemical biology analysis. J Chem Inf Model 49: 308–317. - PubMed
-
- Hopkins AL (2008) Network pharmacology: the next paradigm in drug discovery. Nat Chem Biol 4: 682–690. - PubMed
-
- Yildirim MA, Goh KI, Cusick ME, Barabasi AL, Vidal M (2007) Drug-target network. Nat Biotechnol 25: 1119–1126. - PubMed
Publication types
MeSH terms
LinkOut - more resources
Full Text Sources
Medical
