

Natural changes in brain temperature underlie variations in song tempo during a mating behavior
- PMID: 23112858
- PMCID: PMC3480430
- DOI: 10.1371/journal.pone.0047856
Natural changes in brain temperature underlie variations in song tempo during a mating behavior
Abstract
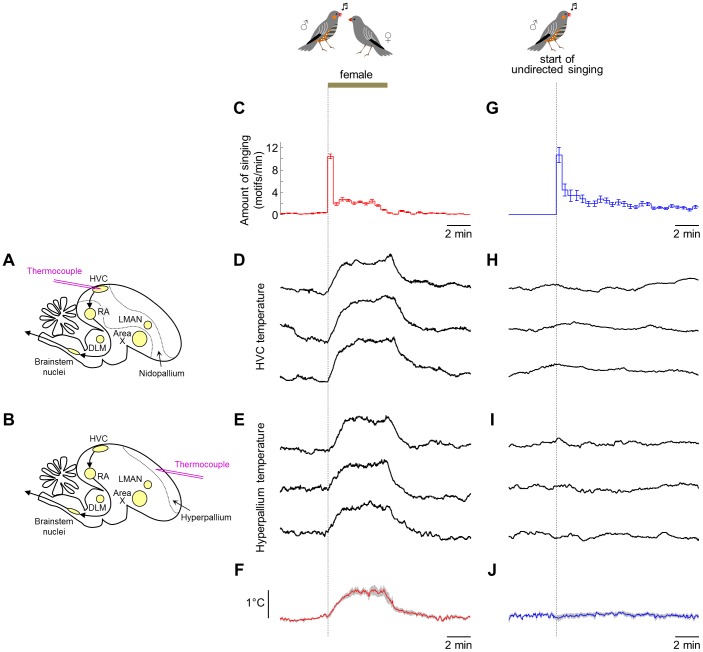
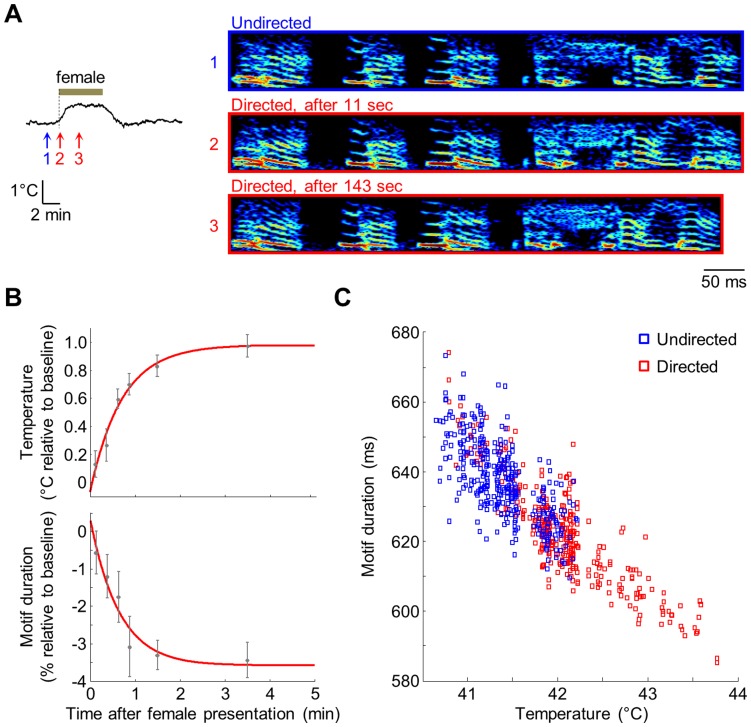
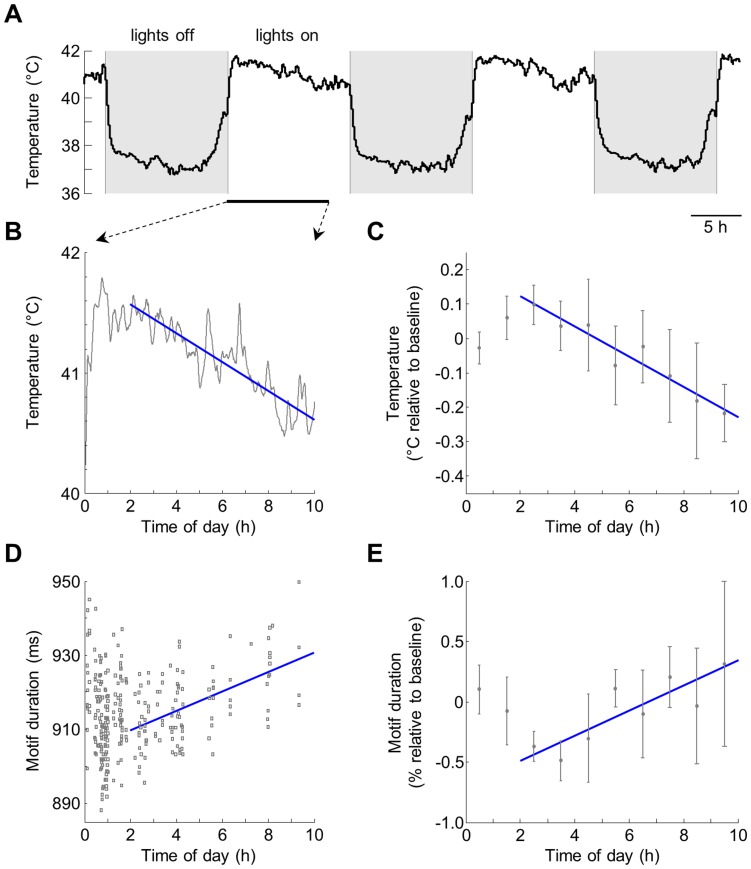
The song of a male zebra finch is a stereotyped motor sequence whose tempo varies with social context--whether or not the song is directed at a female bird--as well as with the time of day. The neural mechanisms underlying these changes in tempo are unknown. Here we show that brain temperature recorded in freely behaving male finches exhibits a global increase in response to the presentation of a female bird. This increase strongly correlates with, and largely explains, the faster tempo of songs directed at a female compared to songs produced in social isolation. Furthermore, we find that the observed diurnal variations in song tempo are also explained by natural variations in brain temperature. Our findings suggest that brain temperature is an important variable that can influence the dynamics of activity in neural circuits, as well as the temporal features of behaviors that some of these circuits generate.
Conflict of interest statement
Figures
Similar articles
-
Physiological insights into the social-context-dependent changes in the rhythm of the song motor program.J Neurophysiol. 2006 Jun;95(6):3798-809. doi: 10.1152/jn.01123.2005. Epub 2006 Mar 22. J Neurophysiol. 2006. PMID: 16554509
-
Developmental modulation and predictability of age-dependent vocal plasticity in adult zebra finches.Brain Res. 2019 Oct 15;1721:146336. doi: 10.1016/j.brainres.2019.146336. Epub 2019 Jul 13. Brain Res. 2019. PMID: 31310739
-
Forebrain circuits underlying the social modulation of vocal communication signals.Dev Neurobiol. 2016 Jan;76(1):47-63. doi: 10.1002/dneu.22298. Epub 2015 Jun 11. Dev Neurobiol. 2016. PMID: 25959605
-
Love songs, bird brains and diffusion tensor imaging.NMR Biomed. 2010 Aug;23(7):873-83. doi: 10.1002/nbm.1551. NMR Biomed. 2010. PMID: 20669169 Review.
-
Female Songbirds: The unsung drivers of courtship behavior and its neural substrates.Behav Processes. 2019 Jun;163:60-70. doi: 10.1016/j.beproc.2017.12.004. Epub 2017 Dec 10. Behav Processes. 2019. PMID: 29237552 Review.
Cited by
-
Brain Temperature Alters Contributions of Excitatory and Inhibitory Inputs to Evoked Field Potentials in the Rat Frontal Cortex.Front Cell Neurosci. 2020 Dec 7;14:593027. doi: 10.3389/fncel.2020.593027. eCollection 2020. Front Cell Neurosci. 2020. PMID: 33364923 Free PMC article.
-
Basal ganglia function, stuttering, sequencing, and repair in adult songbirds.Sci Rep. 2014 Oct 13;4:6590. doi: 10.1038/srep06590. Sci Rep. 2014. PMID: 25307086 Free PMC article.
-
Sleep replay reveals premotor circuit structure for a skilled behavior.Neuron. 2021 Dec 1;109(23):3851-3861.e4. doi: 10.1016/j.neuron.2021.09.021. Epub 2021 Oct 8. Neuron. 2021. PMID: 34626537 Free PMC article.
-
Replay of innate vocal patterns during night sleep in suboscines.Proc Biol Sci. 2021 Jun 30;288(1953):20210610. doi: 10.1098/rspb.2021.0610. Epub 2021 Jun 30. Proc Biol Sci. 2021. PMID: 34187198 Free PMC article.
-
Development of temporal structure in zebra finch song.J Neurophysiol. 2013 Feb;109(4):1025-35. doi: 10.1152/jn.00578.2012. Epub 2012 Nov 21. J Neurophysiol. 2013. PMID: 23175805 Free PMC article.
References
-
- Philippot P, Feldman RS (1999) The social context of nonverbal behavior. Cambridge University Press. 364 p.
-
- McGregor PK (2005) Animal communication networks. Cambridge University Press. 680 p.
-
- Sossinka R, Böhner J (1980) Song types in the zebra finch Poephila guttata castanotis. Zeitschrift für Tierpsychologie 53: 123–132. - PubMed
-
- Hessler NA, Doupe AJ (1999) Social context modulates singing-related neural activity in the songbird forebrain. Nat Neurosci 2: 209–211. - PubMed
-
- Kao MH, Brainard MS (2006) Lesions of an avian basal ganglia circuit prevent context-dependent changes to song variability. J Neurophysiol 96: 1441–1455. - PubMed
Publication types
MeSH terms
Grants and funding
LinkOut - more resources
Full Text Sources
Molecular Biology Databases
