

Aflatoxin B1 up-regulates insulin receptor substrate 2 and stimulates hepatoma cell migration
- PMID: 23112878
- PMCID: PMC3480444
- DOI: 10.1371/journal.pone.0047961
Aflatoxin B1 up-regulates insulin receptor substrate 2 and stimulates hepatoma cell migration
Abstract
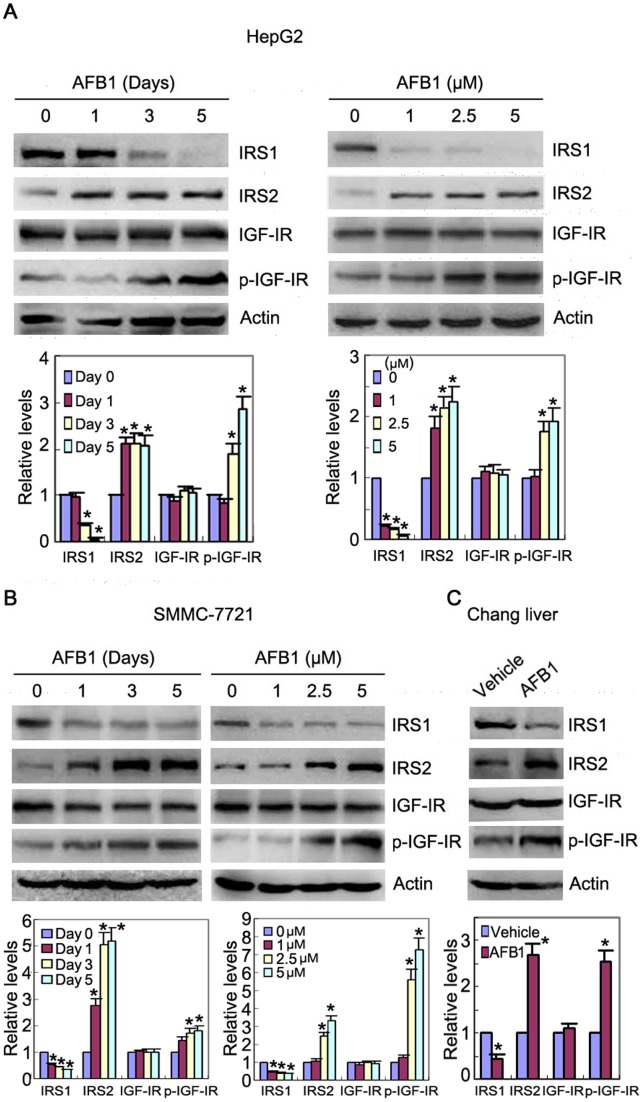
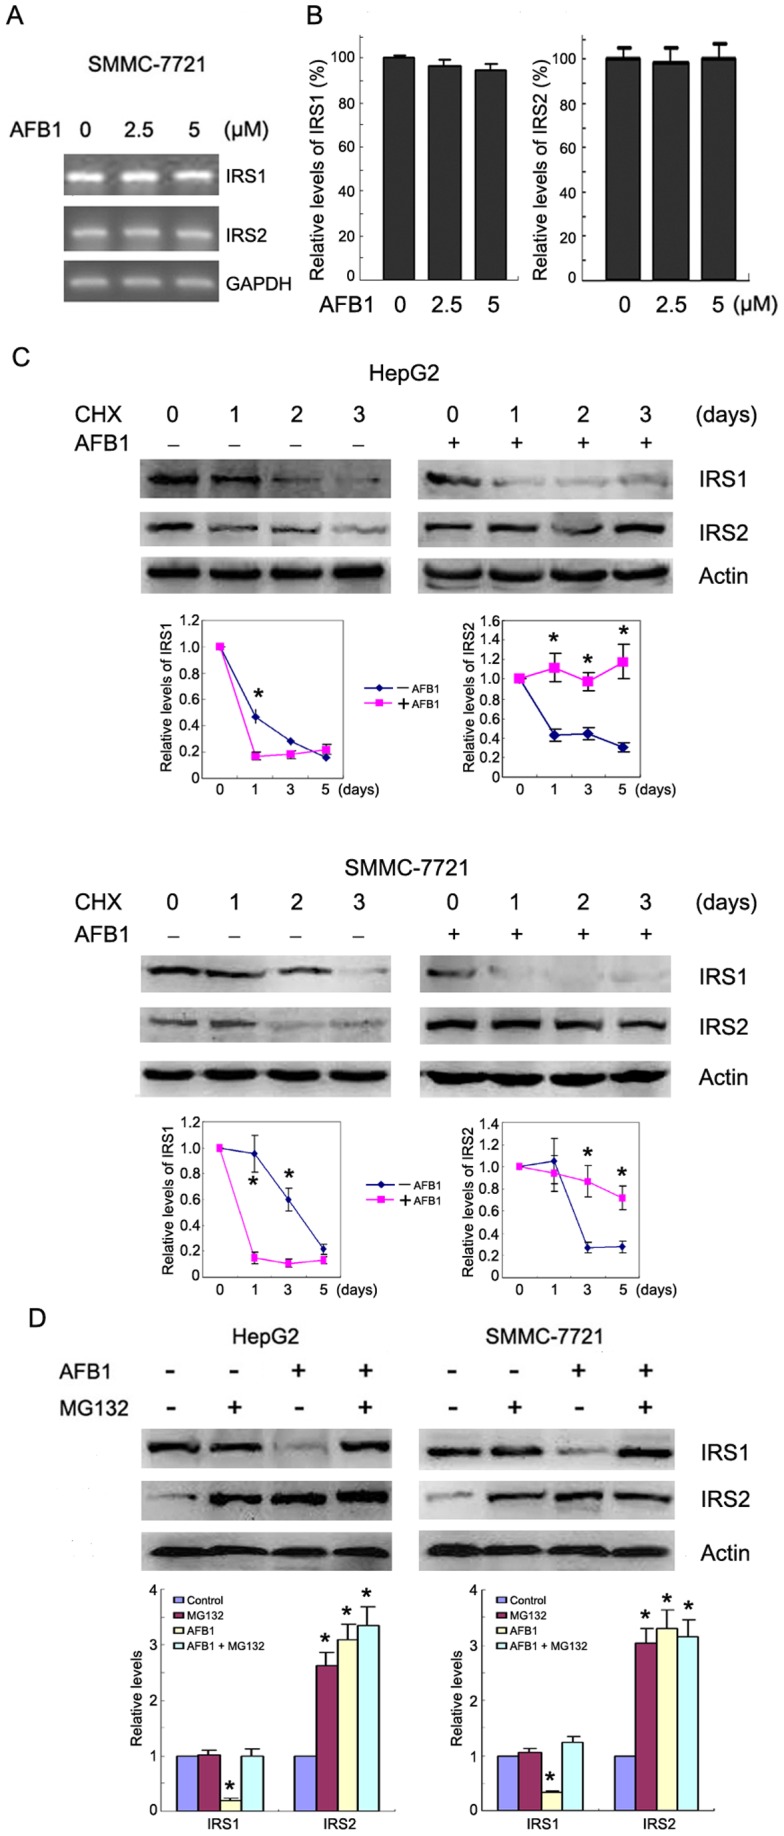
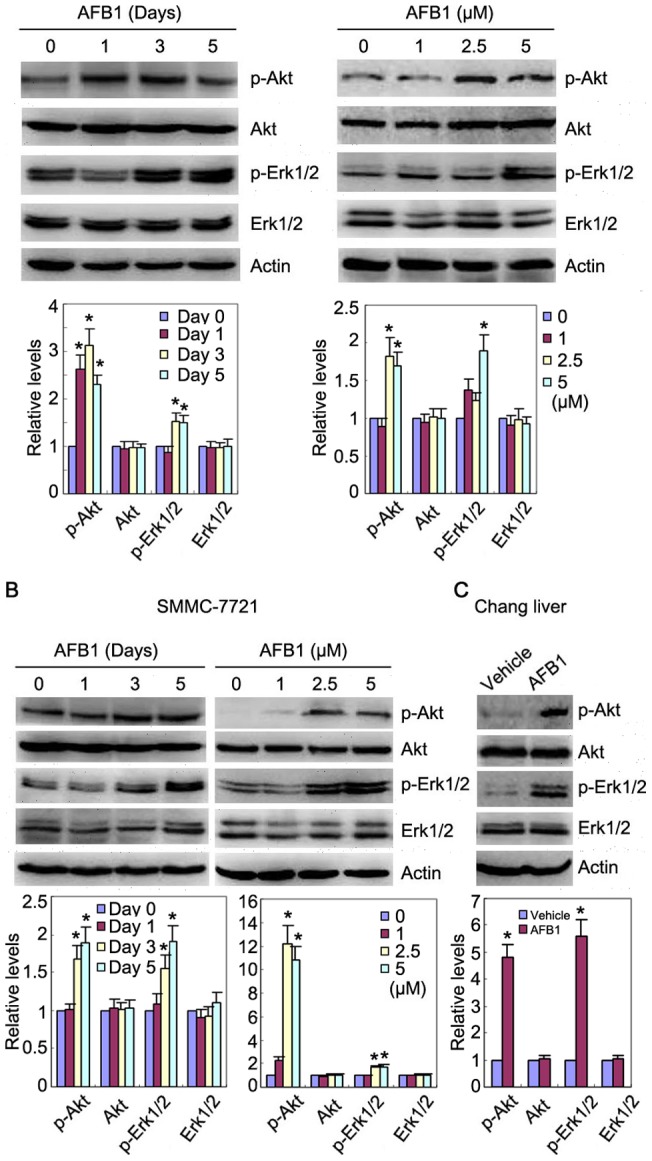
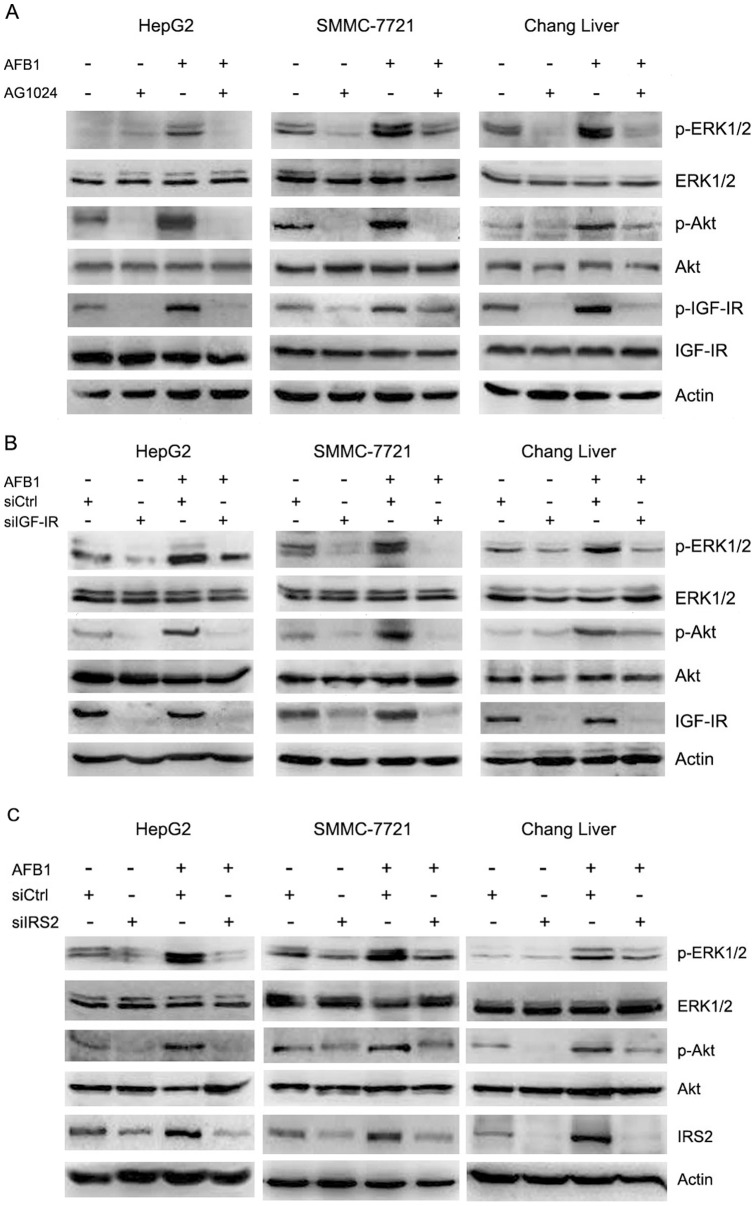
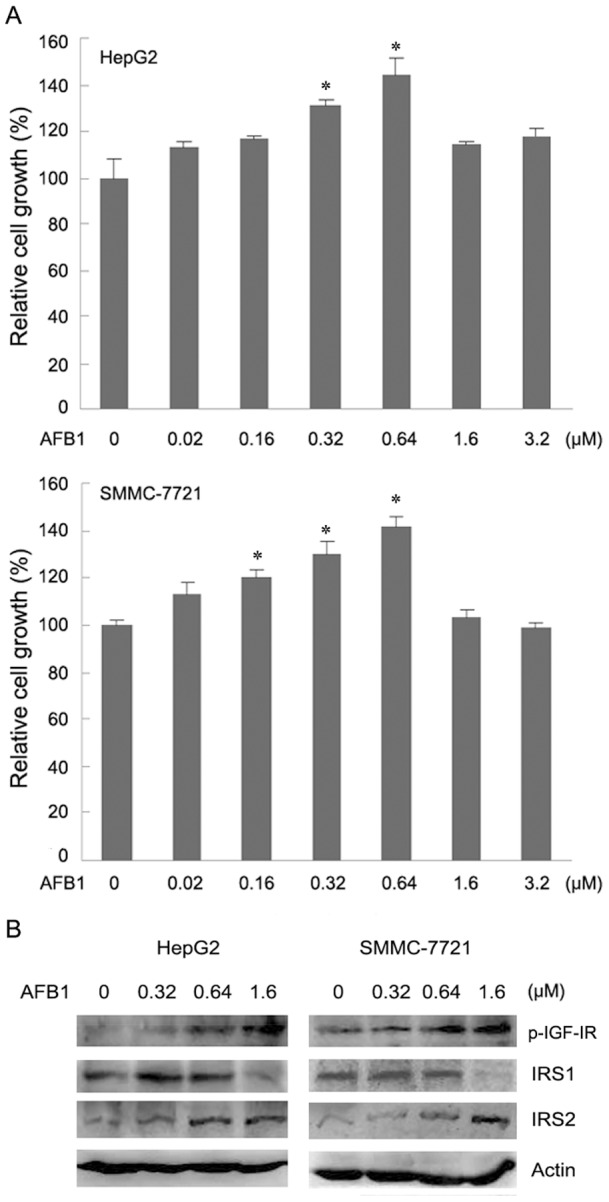
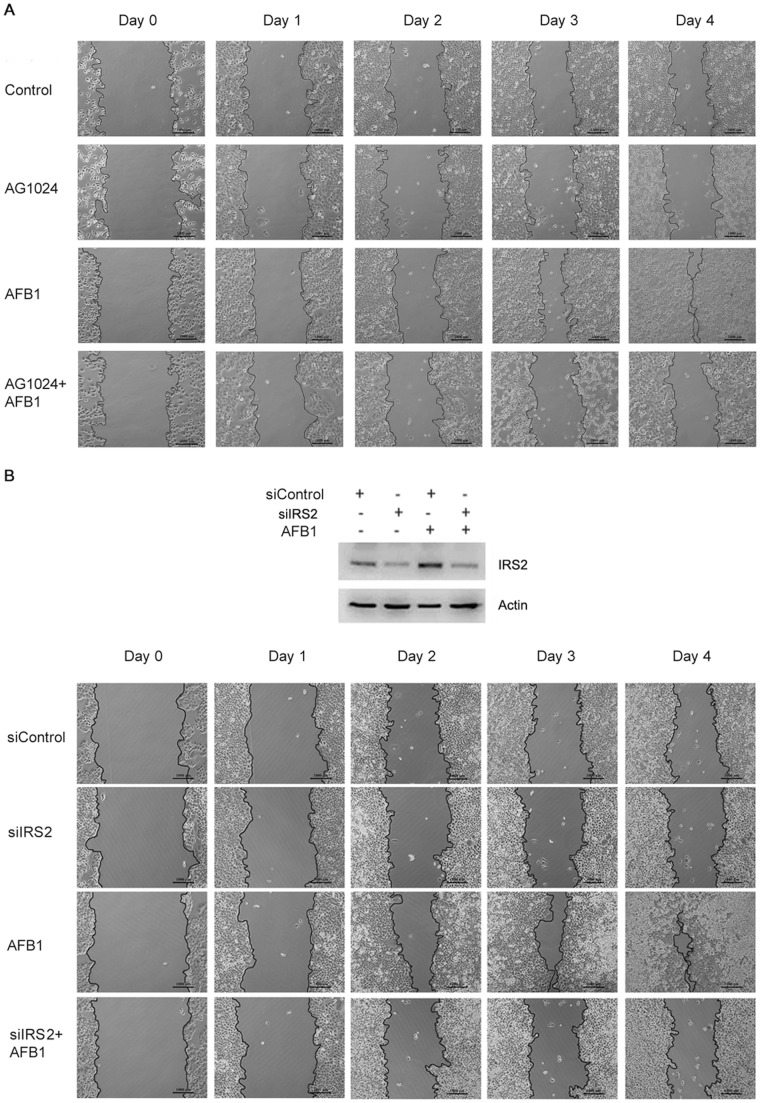
Aflatoxin B1 (AFB1) is a potent carcinogen that can induce hepatocellular carcinoma. AFB1-8,9-exo-epoxide, one of AFB1 metabolites, acts as a mutagen to react with DNA and induce gene mutations, including the tumor suppressor p53. In addition, AFB1 reportedly stimulates IGF receptor activation. Aberrant activation of IGF-I receptor (IGF-IR) signaling is tightly associated with various types of human tumors. In the current study, we investigated the effects of AFB1 on key elements in IGF-IR signaling pathway, and the effects of AFB1 on hepatoma cell migration. The results demonstrated that AFB1 induced IGF-IR, Akt, and Erk1/2 phosphorylation in hepatoma cell lines HepG2 and SMMC-7721, and an immortalized human liver cell line Chang liver. AFB1 also down-regulated insulin receptor substrate (IRS) 1 but paradoxically up-regulated IRS2 through preventing proteasomal degradation. Treatment of hepatoma cells and Chang liver cells with IGF-IR inhibitor abrogated AFB1-induced Akt and Erk1/2 phosphorylation. In addition, IRS2 knockdown suppressed AFB1-induced Akt and Erk1/2 phosphorylation. Finally, AFB1 stimulated hepatoma cell migration. IGF-IR inhibitor or IRS2 knockdown suppressed AFB1-induced hepatoma cell migration. These data demonstrate that AFB1 stimulates hepatoma cell migration through IGF-IR/IRS2 axis.
Conflict of interest statement
Figures
Similar articles
-
Aflatoxin B1 induces Src phosphorylation and stimulates lung cancer cell migration.Tumour Biol. 2015 Aug;36(8):6507-13. doi: 10.1007/s13277-015-3341-2. Epub 2015 Mar 29. Tumour Biol. 2015. PMID: 25820822
-
The reciprocal regulation of gamma-synuclein and IGF-I receptor expression creates a circuit that modulates IGF-I signaling.J Biol Chem. 2010 Oct 1;285(40):30480-8. doi: 10.1074/jbc.M110.131698. Epub 2010 Jul 29. J Biol Chem. 2010. PMID: 20670935 Free PMC article.
-
Clinical features of aflatoxin B1-exposed patients with liver cancer and the molecular mechanism of aflatoxin B1 on liver cancer cells.Environ Toxicol Pharmacol. 2019 Oct;71:103225. doi: 10.1016/j.etap.2019.103225. Epub 2019 Jul 25. Environ Toxicol Pharmacol. 2019. PMID: 31376682
-
Aflatoxin B1: A review on metabolism, toxicity, occurrence in food, occupational exposure, and detoxification methods.Food Chem Toxicol. 2019 Feb;124:81-100. doi: 10.1016/j.fct.2018.11.047. Epub 2018 Nov 20. Food Chem Toxicol. 2019. PMID: 30468841 Review.
-
An evaluation of the role of insulin-like growth factors (IGF) and of type-I IGF receptor signalling in hepatocarcinogenesis and in the resistance of hepatocarcinoma cells against drug-induced apoptosis.Biochem Pharmacol. 2004 Sep 15;68(6):1003-15. doi: 10.1016/j.bcp.2004.05.029. Biochem Pharmacol. 2004. PMID: 15313394 Review.
Cited by
-
May phytophenolics alleviate aflatoxins-induced health challenges? A holistic insight on current landscape and future prospects.Front Nutr. 2022 Oct 28;9:981984. doi: 10.3389/fnut.2022.981984. eCollection 2022. Front Nutr. 2022. PMID: 36386916 Free PMC article. Review.
-
The Novel Functions of High-Molecular-Mass Complexes Containing Insulin Receptor Substrates in Mediation and Modulation of Insulin-Like Activities: Emerging Concept of Diverse Functions by IRS-Associated Proteins.Front Endocrinol (Lausanne). 2015 May 26;6:73. doi: 10.3389/fendo.2015.00073. eCollection 2015. Front Endocrinol (Lausanne). 2015. PMID: 26074875 Free PMC article. Review.
-
Aflatoxin B1 negatively regulates Wnt/β-catenin signaling pathway through activating miR-33a.PLoS One. 2013 Aug 27;8(8):e73004. doi: 10.1371/journal.pone.0073004. eCollection 2013. PLoS One. 2013. PMID: 24015284 Free PMC article.
-
Aflatoxin B1 and Epstein-Barr virus-induced CCL22 expression stimulates B cell infection.Proc Natl Acad Sci U S A. 2024 Apr 16;121(16):e2314426121. doi: 10.1073/pnas.2314426121. Epub 2024 Apr 4. Proc Natl Acad Sci U S A. 2024. PMID: 38574017 Free PMC article.
-
Inhibitory Effects of Eurotium cristatum on Growth and Aflatoxin B1 Biosynthesis in Aspergillus flavus.Front Microbiol. 2020 May 15;11:921. doi: 10.3389/fmicb.2020.00921. eCollection 2020. Front Microbiol. 2020. PMID: 32477315 Free PMC article.
References
-
- Wild CP, Montesano R (2009) A model of interaction: aflatoxins and hepatitis viruses in liver cancer aetiology and prevention. Cancer Lett 286: 22–28. - PubMed
-
- Ross RK, Yu MC, Henderson BE, Yuan JM, Qian JS, et al. (1992) Urinary aflatoxin biomarkers and risk of hepatocellular carcinoma. Lancet 339: 943–946. - PubMed
Publication types
MeSH terms
Substances
LinkOut - more resources
Full Text Sources
Medical
Research Materials
Miscellaneous
