

Comparing local and regional variation in health care spending
- PMID: 23113483
- PMCID: PMC3490218
- DOI: 10.1056/NEJMsa1203980
Comparing local and regional variation in health care spending
Abstract
Background: Wide geographic variation in health care spending has generated both concern about inefficiency and policy debate about geographic-based payment reform. Evidence regarding variation has focused on hospital referral regions (HRRs), which incorporate numerous local hospital service areas (HSAs). If there is substantial variation across local areas within HRRs, then policies focusing on HRRs may be poorly targeted.
Methods: Using prescription drug and medical claims data from a 5% random sample of Medicare beneficiaries from 2006 through 2009, we compared variation in health care spending and utilization among 306 HRRs and 3436 HSAs. We adjusted for beneficiary-level demographic characteristics, insurance status, and clinical characteristics.
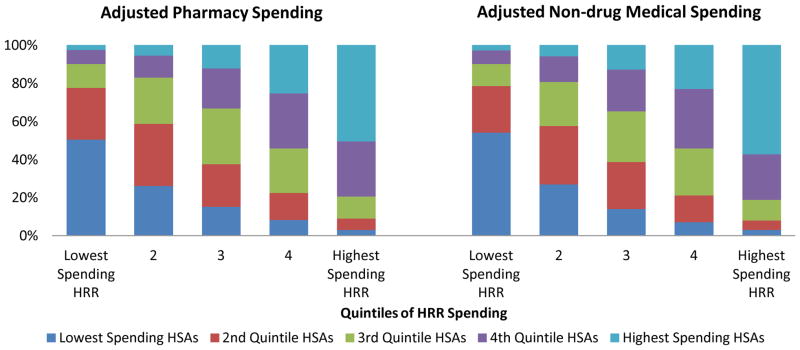
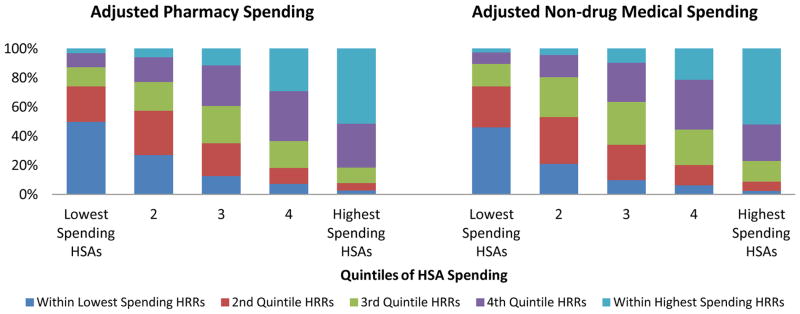
Results: There was substantial local variation in health care (drug and nondrug) utilization and spending. Furthermore, many of the low-spending HSAs were located in high-spending HRRs, and many of the high-spending HSAs were in low-spending HRRs. For drug spending, only 50.7% of the HSAs located within the borders of the highest-spending quintile of HRRs were in the highest-spending quintile of HSAs; conversely, only 51.5% of the highest-spending HSAs were located within the borders of the highest-spending HRRs. Similar patterns were observed for nondrug spending.
Conclusions: The effectiveness of payment reforms in reducing overutilization while maintaining access to high-quality care depends on the effectiveness of targeting. Our analysis suggests that HRR-based policies may be too crudely targeted to promote the best use of health care resources. (Funded by the Institute of Medicine and others.).
Conflict of interest statement
Baicker is a Commissioner on the Medicare Payment Advisory Commission and a director of Eli Lilly.
Figures
References
-
- The Dartmouth Atlas Project. The Dartmouth Atlas of Health Care. Lebanon, NH: 2010.
-
- Fisher ES, Wennberg DE, Stukel TA, Gottlieb DJ, Lucas FL, Pinder EL. The implications of regional variations in Medicare spending. Part 2: health outcomes and satisfaction with care. Ann Intern Med. 2003;138:288–98. - PubMed
-
- Fisher ES, Wennberg DE, Stukel TA, Gottlieb DJ, Lucas FL, Pinder EL. The implications of regional variations in Medicare spending. Part 1: the content, quality, and accessibility of care. Ann Intern Med. 2003;138:273–87. - PubMed
Publication types
MeSH terms
Grants and funding
LinkOut - more resources
Full Text Sources