. 2012 Oct 31:13:283.
doi: 10.1186/1471-2105-13-283.

Denoising PCR-amplified metagenome data

Affiliations

Denoising PCR-amplified metagenome data

Michael J Rosen et al. BMC Bioinformatics. .

Abstract

Background: PCR amplification and high-throughput sequencing theoretically enable the characterization of the finest-scale diversity in natural microbial and viral populations, but each of these methods introduces random errors that are difficult to distinguish from genuine biological diversity. Several approaches have been proposed to denoise these data but lack either speed or accuracy.

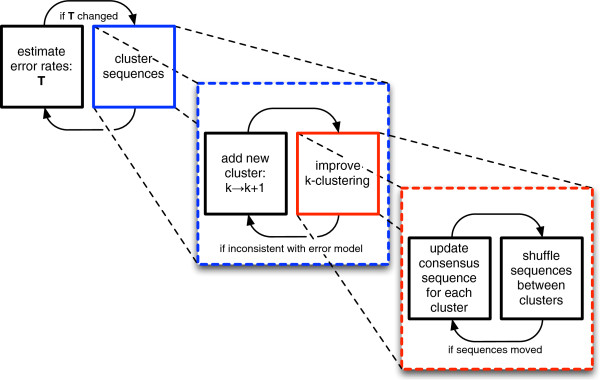
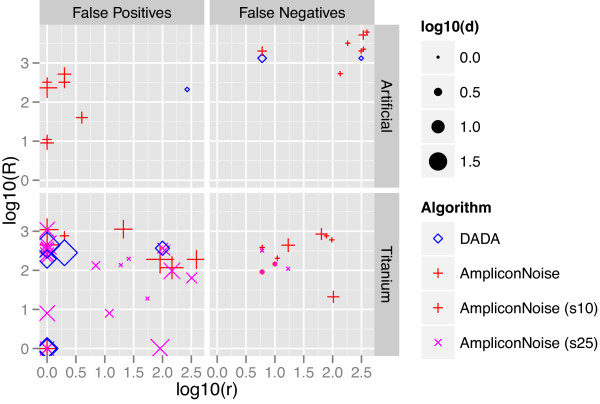
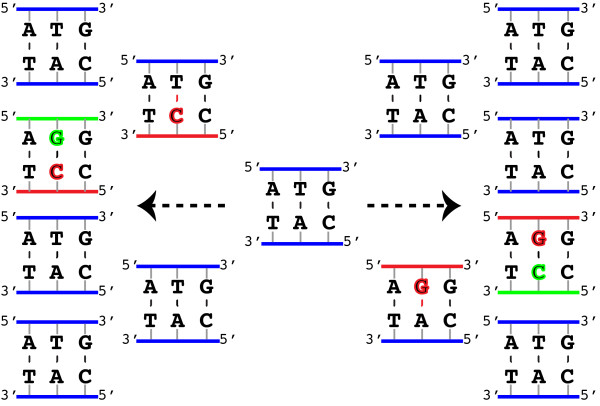
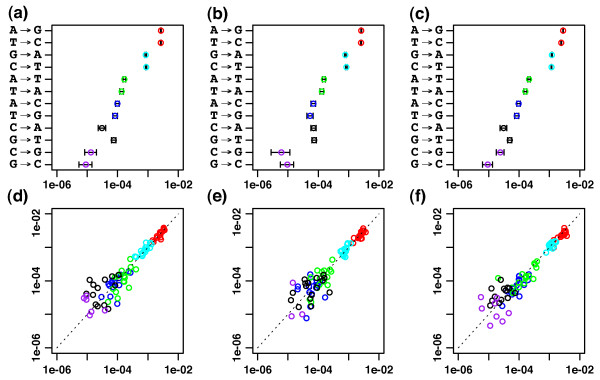
Results: We introduce a new denoising algorithm that we call DADA (Divisive Amplicon Denoising Algorithm). Without training data, DADA infers both the sample genotypes and error parameters that produced a metagenome data set. We demonstrate performance on control data sequenced on Roche's 454 platform, and compare the results to the most accurate denoising software currently available, AmpliconNoise.

Conclusions: DADA is more accurate and over an order of magnitude faster than AmpliconNoise. It eliminates the need for training data to establish error parameters, fully utilizes sequence-abundance information, and enables inclusion of context-dependent PCR error rates. It should be readily extensible to other sequencing platforms such as Illumina.


Figures

Figure 1
Figure 1
DADA schematic. The basic structure of DADA, an algorithm to denoise amplicon sequence data. See Algorithm Algorithm 1 in the Methods section for the pseudocode and a more detailed description.
Figure 2
Figure 2
Discrimination plots for a typical cluster in the Artificial data set with 4691 reads. (a) simulated errors drawn from the error model and (b) the real errors in the cluster. Sequences (diamonds) are characterized by abundance and the probability λper read of having been produced. On the x-axis, we plot logλscaled by the most common error probability, TA→G, so that values can be interpreted as an effective Hamming distance. The dashed lines delineate the region – the lower left quadrant – where, for significance thresholds Ωaand Ωr provided by the user, DADA accepts that a sequence could have arisen via the error model. The vertical dashed lines shows the λbelow which (or the effective distance above which) the read p-value rejects sequences as being errors, and the curved dashed line shows the abundances above which the abundance p-value rejects sequences as being errors for each value of λ. There are several sequences in the real data (red diamonds) that would be rejected by the abundance p-value at the Ωa = .01 significance level; we posit that early round PCR effects are a suitable candidate to explain these departures from the error model.
Figure 3
Figure 3
Ad hoc Ωa choices for the Divergent (a) and (d), Artificial (b) and (e), and Titanium (c) and (f) data sets. (a)-(c) are histograms of the Ωathreshold at which each cluster derived from a run of DADA with Ωa=Ωr=10−3rejoins some other nearby cluster. Genuine genotype counts are shown in blue and false positive counts are shown in red. The first gaps in these histograms were used to pick Ωathresholds for reclustering the data, and are indicated by vertical dashed lines. (d)-(f) show the Ωadiscrimination lines for the largest cluster in each data set (with 2294, 5479, and 1095 reads) for Ωa=10−3and the associated ad hoc Ωavalues.
Figure 4
Figure 4
Nature of false positives and false negatives of DADA and AmpliconNoise on Artificial and Titanium data sets. False positives are characterized by the number of reads associated with the falsely inferred genotype r, the distance to the nearest real sequence d, and the number of reads associated with that nearest real sequence R. False negatives are characterized by the number of reads that matched the missing genotype r, the distance from that missing genotype to the nearest inferred genotype d, and the number of reads associated with that nearest inferred genotype R.
Figure 5
Figure 5
Two paths to the same error. Different mispaired bases (red) produce the same double stranded product once paired with complementary bases (green) so that each path leads to an ATGAGG substitution error on one strand and a CATCCT on the other. The probability of these two errors is therefore expected to be very similar.
Figure 6
Figure 6
Error probability symmetries for Divergent (a) and (d), Artificial (b) and (e), and Titanium (c) and (f) data sets. (a)-(c): context-independent substitution error probabilities inferred by DADA with 95% confidence intervals based on binomial sampling error. Note the approximate symmetry between ijand īj¯ probabilities (which show up contiguously along the y-axis), where ī denotes the complement of nucleotide i. (d)-(f): All 96 reverse-complementary pairs of context-dependent error probabilities inferred by DADA for each data set. For each pair, the probability of the error away from an A or C is plotted on the x-axis and the error probability away from T or G is plotted on the y-axis. The pairing between these probabilities – seen by the tendency to lie along the diagonal – is stronger for the largest probabilities, which have the least sampling noise. The colors signify complementary pairs of errors red = (AG,TC) cyan=(CT,GA) green=(AT,TA) black=(CA,GT) blue=(AC,TG) purple=(CG,GC).

References

    1. Cheung MK, Au CH, Chu KH, Kwan HS, Wong CK. Composition and genetic diversity of picoeukaryotes in subtropic coastal waters as revealed by 454 pyrosequencing. ISME J. 2010;4:1053–1059. doi: 10.1038/ismej.2010.26. - DOI - PubMed
    1. Iwai S, Chai B, Sul WJ, Cole JR, Hashsham SA, Tiedje JM. Gene-targeted-metagenomics reveals extensive diversity of aromatic dioxygenase genes in the environment. ISME J. 2010;4:279–285. doi: 10.1038/ismej.2009.104. - DOI - PMC - PubMed
    1. Teixeria LCRS, Peixoto RS, Cury JC, Sul WJ, Pellizari VH, Tiedje J, Rosado AS. Bacterial diversity in rhizosphere soil from Antarctic vascular plants of Admiralty Bay, maritime Antarctica. ISME J. 2010;4:989–1001. doi: 10.1038/ismej.2010.35. - DOI - PubMed
    1. Huse SM, Dethlefsen L, Huber JA, Welch DM, Relman DA, Sogin ML. Exploring microbial diversity and taxonomy using SSU rRNA hypervariable tag sequencing. PLoS Genet. 2008;4:e1000255. doi: 10.1371/journal.pgen.1000255. - DOI - PMC - PubMed
    1. Wilmes P, Simmons SL, Denef VJ, Banfield JF. The dynamic genetic repertoire of microbial communities. FEMS Microbiol Rev. 2009;33:109–132. doi: 10.1111/j.1574-6976.2008.00144.x. - DOI - PMC - PubMed

Publication types

MeSH terms

LinkOut - more resources