. 2012 Dec;122(12):4635-44.
doi: 10.1172/JCI63924. Epub 2012 Nov 1.

Hypoxia-inducible factor regulates hepcidin via erythropoietin-induced erythropoiesis

Affiliations

Hypoxia-inducible factor regulates hepcidin via erythropoietin-induced erythropoiesis

Qingdu Liu et al. J Clin Invest. 2012 Dec.

Abstract

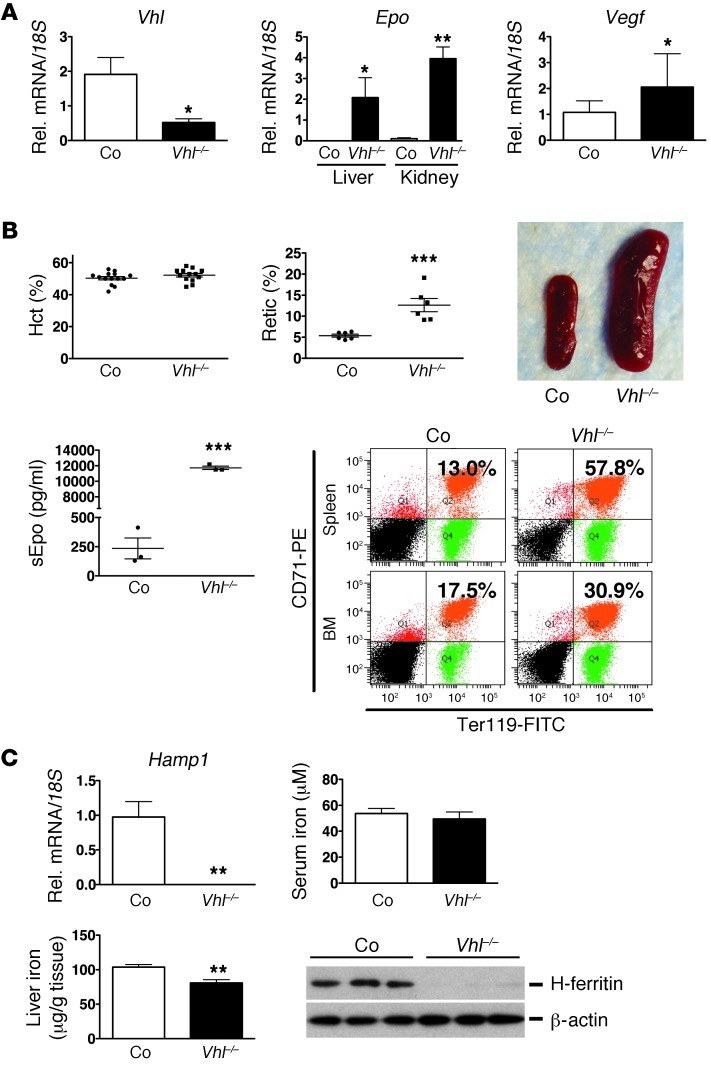
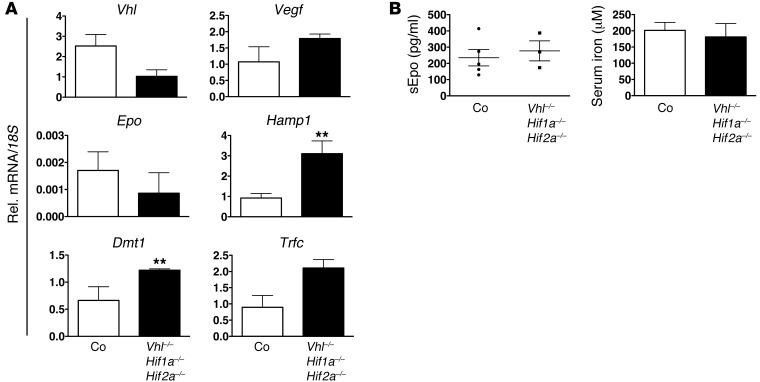
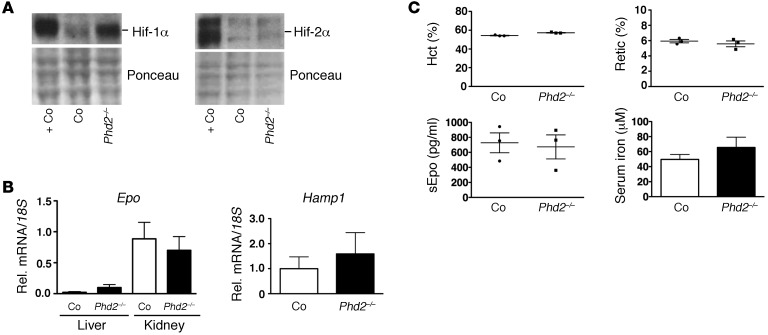
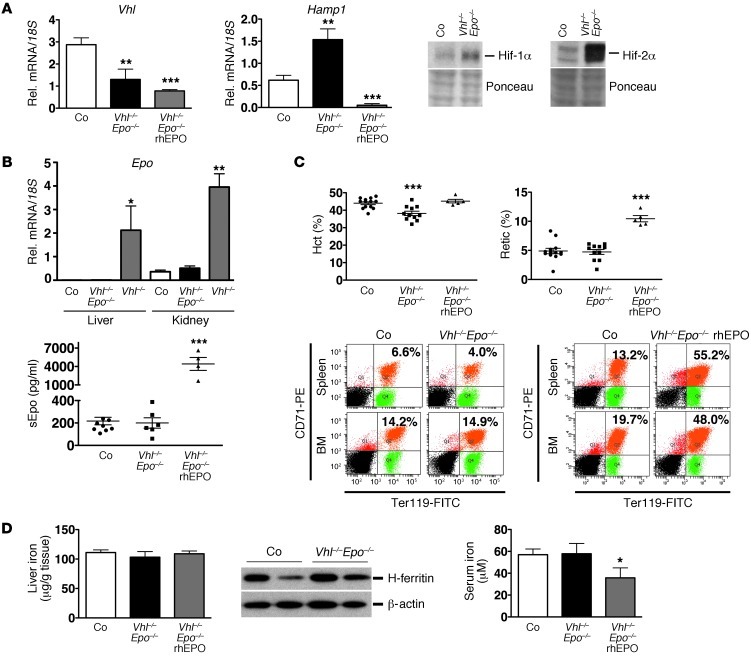
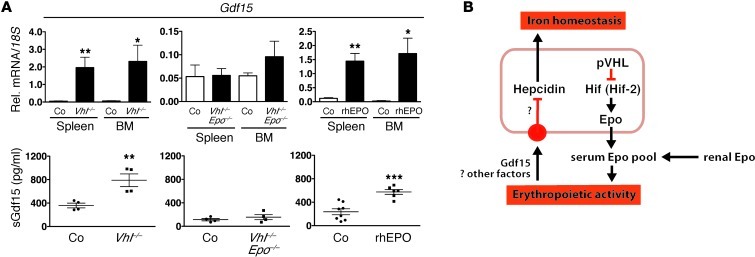
Iron demand in bone marrow increases when erythropoiesis is stimulated by hypoxia via increased erythropoietin (EPO) synthesis in kidney and liver. Hepcidin, a small polypeptide produced by hepatocytes, plays a central role in regulating iron uptake by promoting internalization and degradation of ferroportin, the only known cellular iron exporter. Hypoxia suppresses hepcidin, thereby enhancing intestinal iron uptake and release from internal stores. While HIF, a central mediator of cellular adaptation to hypoxia, directly regulates renal and hepatic EPO synthesis under hypoxia, the molecular basis of hypoxia/HIF-mediated hepcidin suppression in the liver remains unclear. Here, we used a genetic approach to disengage HIF activation from EPO synthesis and found that HIF-mediated suppression of the hepcidin gene (Hamp1) required EPO induction. EPO induction was associated with increased erythropoietic activity and elevated serum levels of growth differentiation factor 15. When erythropoiesis was inhibited pharmacologically, Hamp1 was no longer suppressed despite profound elevations in serum EPO, indicating that EPO by itself is not directly involved in Hamp1 regulation. Taken together, we provide in vivo evidence that Hamp1 suppression by the HIF pathway occurs indirectly through stimulation of EPO-induced erythropoiesis.


Figures

Figure 1
Figure 1. Inactivation of Vhl suppresses Hamp1.
(A) Shown are results from real-time PCR analysis of Vhl and Vegf mRNA levels in Vhl–/– livers (n = 3) and Epo mRNA levels in Vhl–/– kidneys and livers (n = 3); analysis was performed on day 8 after the first tamoxifen injection. Relative mRNA expression levels were normalized to 18S ribosomal RNA. (B) Global inactivation of Vhl induces erythropoiesis. Shown are individual Hct values (n = 14 and 13, respectively), reticulocyte counts (%) (n = 6 each), and serum Epo concentrations (sEpo) (n = 3 each) from control and mutant mice and a representative picture of a control and a Vhl–/– spleen. Lower right panel shows a representative FACS plot of CD71/Ter119 double-stained BM and spleen cells from an individual control mouse and Vhl mutant. Percentages of CD71hi/Ter119hi-positive cells (right upper quadrant) are indicated. (C) Shown are relative expression levels of Hamp1 mRNA in control and Vhl–/– livers (n = 5 and 3, respectively) and serum iron (n = 3 each) and liver iron concentrations (n = 7 and 4, respectively). H-ferritin protein levels in control and Vhl–/– livers were determined by immunoblot in 3 mice, β-actin served as loading control. Asterisks indicate a statistically significant difference when comparisons were made to the control group: *P < 0.05; **P< 0.01; ***P< 0.001. Shown are arithmetic mean values ± SEM. Co, Cre-negative littermate control; retic, reticulocytes.
Figure 2
Figure 2. Hamp1 suppression in Vhl–/– livers is Hif dependent.
(A) Real-time PCR analysis of Vhl, Vegf, Epo, Hamp1, Dmt1, and Trfc expression in Vhl/Hif1a/Hif2a–/– livers. Relative mRNA expression levels were normalized to 18S ribosomal RNA. Bars represent arithmetic mean values ± SEM (n = 3). (B) Serum Epo concentrations and serum iron levels in Vhl/Hif1a/Hif2a–/– mice (n = 3). Circles and squares represent data points for individual mice. Error bars represent SEM. *P < 0.05; **P< 0.01, for comparisons with controls.
Figure 3
Figure 3. Hepatocyte-specific inactivation of Phd2 does not suppress Hamp1.
(A) Hif-1α and Hif-2α protein levels in Phd2–/– livers. Ponceau staining is used to assess for equal protein loading. +Co, positive control sample obtained from Vhl–/– livers. (B) Hepatocyte-specific inactivation of Phd2 does not increase Epo mRNA and does not suppress Hamp1 mRNA levels in Phd2–/– livers. Shown are relative mRNA expression levels normalized to 18S ribosomal RNA in mutant and control livers. Corresponding renal Epo mRNA levels are shown for comparison (n = 3). (C) Hct, reticulocyte counts, and serum Epo and serum iron levels in control and Phd2 mutant mice (n = 3 each). Shown are mean values ± SEM. For statistical analysis, mutants were compared with controls.
Figure 4
Figure 4. Hif-mediated Hamp1 suppression is Epo dependent.
(A). Hepatic Vhl and Hamp1 mRNA levels in control, Vhl/Epo–/–, and Vhl/Epo–/– mice treated with rhEPO (n = 6, 6, and 5, respectively). Right panel shows Hif-1α and Hif-2α protein levels in Vhl/Epo–/– livers. Ponceau staining is used to assess for equal protein loading. (B) Epo levels in control, Vhl/Epo–/–, and Vhl–/– livers and kidneys (n = 6, 6, and 3, respectively). Bottom panel shows serum Epo concentrations in control, Vhl/Epo–/–, and Vhl/Epo–/– mice treated with rhEPO (n = 10, 6, and 4, respectively). (C) Hct and reticulocyte counts in control, Vhl/Epo–/–, and rhEPO-treated Vhl/Epo–/– mice and representative FACS analysis plot of CD71/Ter119-stained BM and spleen cells from 1 control and 1 mutant mouse. Percentages of CD71hiTer119hi-positive cells are indicated in the right upper quadrant. (D) Liver (n = 8, 4, and 5, respectively) and serum iron concentrations (n = 10, 6, and 4, respectively) in control, Vhl/Epo–/–, and Vhl/Epo–/– mice treated with rhEPO, and H-ferritin protein levels in control and Vhl/Epo–/– livers. β-actin served as loading control. Shown are mean values ± SEM. *P < 0.05; **P < 0.01; ***P < 0.001, for comparisons of mutants with controls. Vhl/Epo–/– (rhEPO), Vhl/Epo double-mutant mice treated with rhEPO.
Figure 5
Figure 5. Hif-associated Hamp1 suppression requires erythropoietic activity.
(A) Renal and hepatic Epo (n = 3, 5, and 3, respectively) in control mice and Vhl–/– mutants with or without Cp treatment and liver Hamp1 RNA levels (n = 6, 4, and 3, respectively) in nontreated control, Cp-treated control, and Cp-treated Vhl–/– mutants. Lower panels show Hct, reticulocyte counts, (n = 3 and 4, respectively), serum Epo (n = 3 and 5, respectively), and spleen to body weight ratios in nontreated control and Cp-treated Vhl–/– mice (n = 3 each). (B) Hamp1 mRNA levels in control and Hif2a/Pax3-cre (P3) mutants exposed to chronic hypoxia (10% O2 for 10 days) (n = 3 each) and in thalassemic mice (th3/th3) and control littermates (+/+) (n = 4 each). Shown are mean values ± SEM. *P < 0.05; **P < 0.01; ***P < 0.001, for comparisons with control group or comparison with normoxia. Cp, mice pretreated with Cp; Hx, treatment with 10% O2 for 10 days.
Figure 6
Figure 6. Elevation of serum Gdf15 in Vhl–/– mice is Epo dependent.
Gdf15 mRNA levels in total spleen and BM cell isolates and corresponding serum Gdf15 levels in pg/ml. (A) Left panels, Vhl–/– mutants and Cre littermate controls (n = 3 and 4, respectively for mRNA analysis; for serum analysis, n = 4 each); middle panels, Vhl/Epo–/– mice and Cre littermate controls (n = 4 each); right panels, WT mice treated with rhEPO or with vehicle (for mRNA analysis, n = 3 and 4, respectively; for serum analysis, n = 6 and 8, respectively). Shown are mean values ± SEM: *P < 0.05; **P< 0.01; ***P < 0.001, for comparisons of mutants with controls. (B) Schematic depiction of Hif’s role in the regulation of hepcidin transcription in hepatocytes. C, Cre-negative littermate control mice or vehicle-treated WT mice.

References

    1. Haase VH. Hypoxic regulation of erythropoiesis and iron metabolism. Am J Physiol Renal Physiol. 2010;299(1):F1–F13. doi: 10.1152/ajprenal.00174.2010. - DOI - PMC - PubMed
    1. Andrews NC. Forging a field: the golden age of iron biology. Blood. 2008;112(2):219–230. doi: 10.1182/blood-2007-12-077388. - DOI - PMC - PubMed
    1. Jelkmann W. Erythropoietin after a century of research: younger than ever. Eur J Haematol. 2007;78(3):183–205. doi: 10.1111/j.1600-0609.2007.00818.x. - DOI - PubMed
    1. Kaelin WG, Ratcliffe PJ. Oxygen sensing by metazoans: the central role of the HIF hydroxylase pathway. Mol Cell. 2008;30(4):393–402. doi: 10.1016/j.molcel.2008.04.009. - DOI - PubMed
    1. Ang SO, et al. Disruption of oxygen homeostasis underlies congenital Chuvash polycythemia. Nat Genet. 2002;32(4):614–621. doi: 10.1038/ng1019. - DOI - PubMed

Publication types

MeSH terms

Substances