

Changes in the properties of normal human red blood cells during in vivo aging
- PMID: 23115087
- PMCID: PMC4067949
- DOI: 10.1002/ajh.23344
Changes in the properties of normal human red blood cells during in vivo aging
Abstract
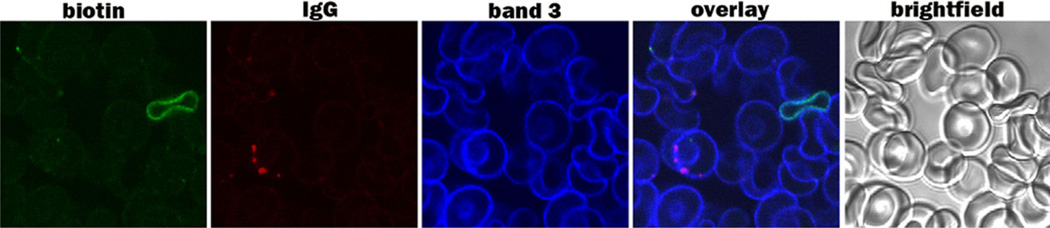
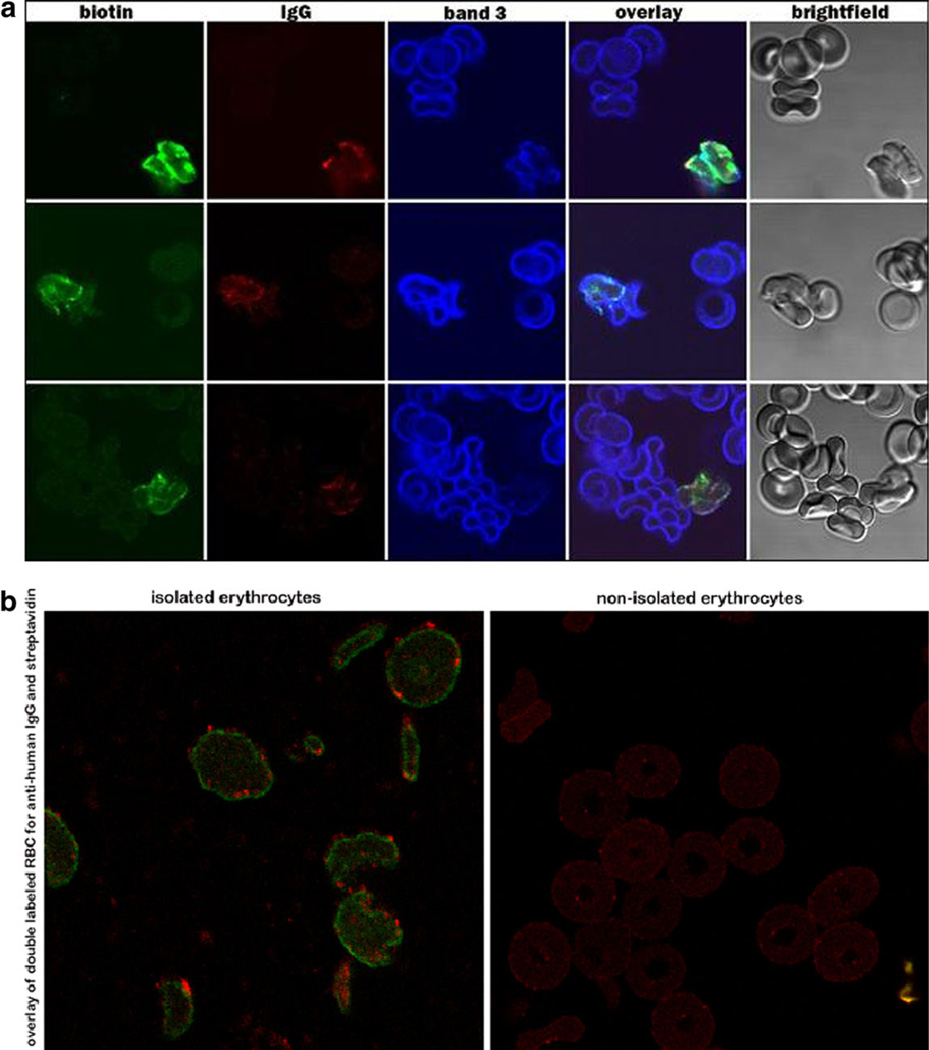
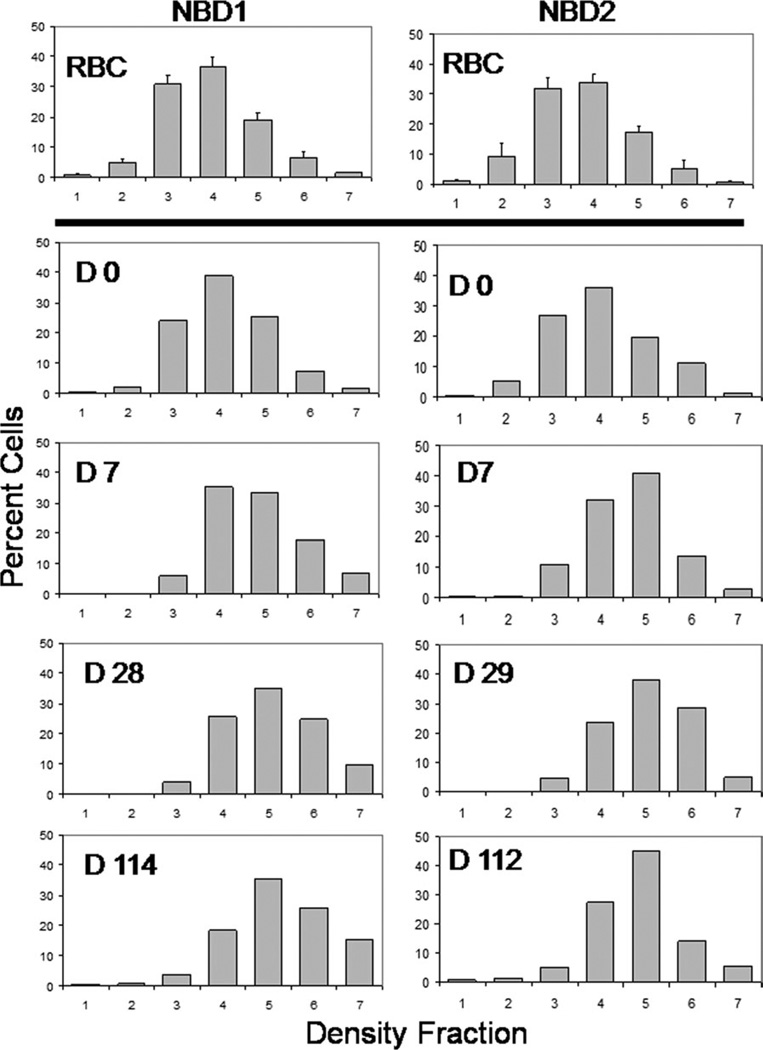
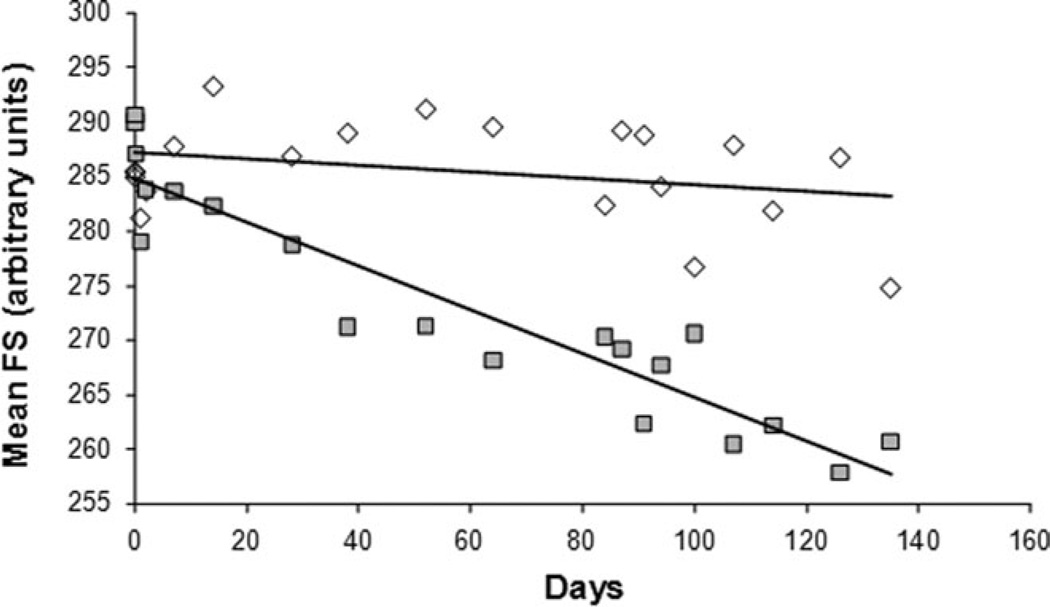
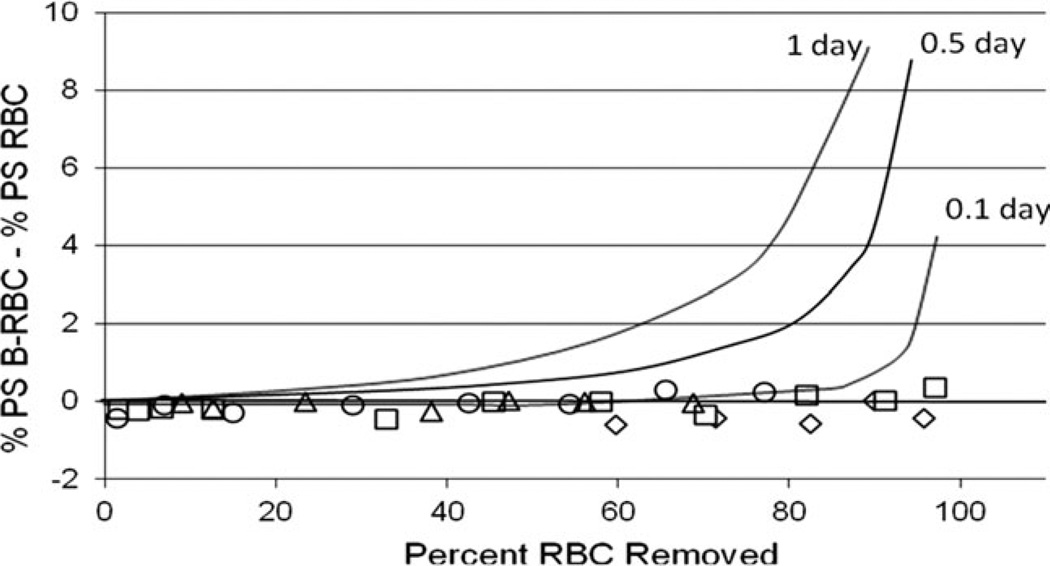
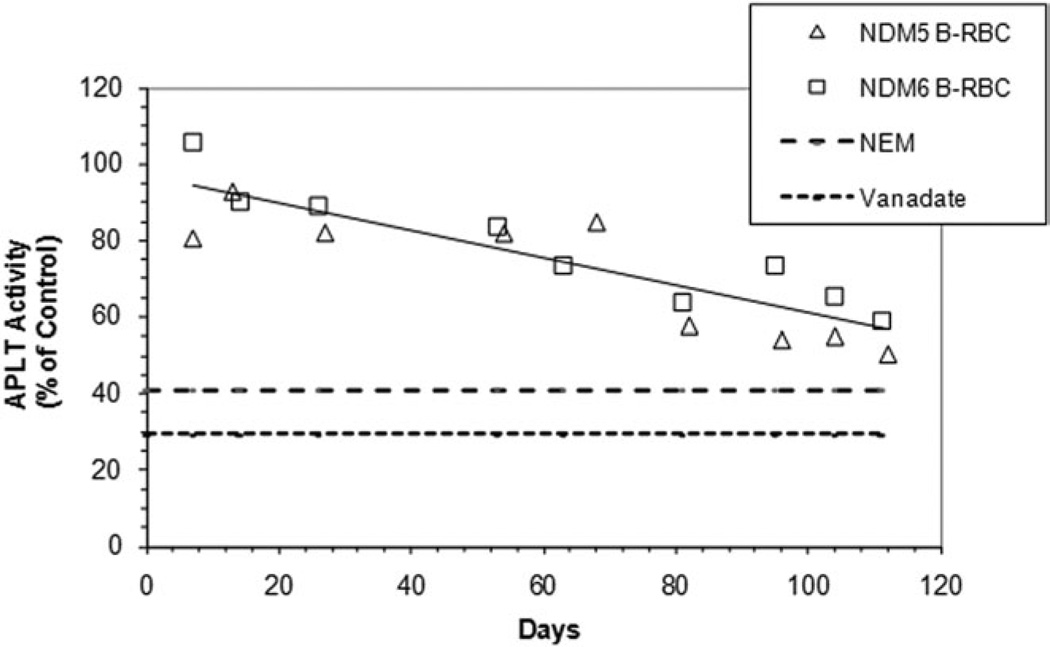
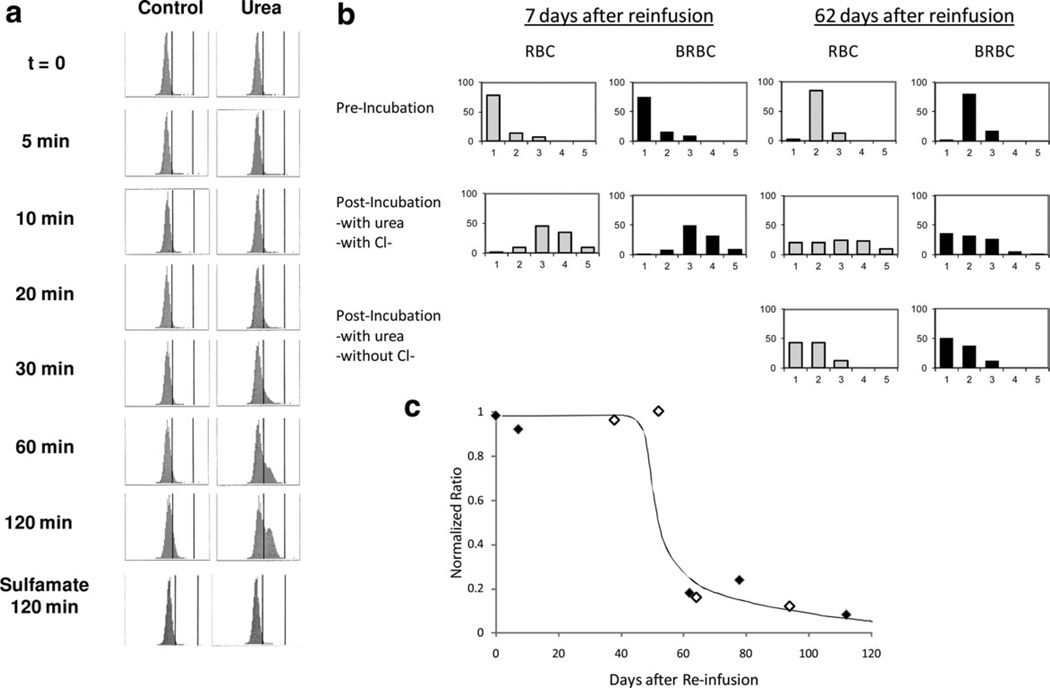
The changes in red blood cells (RBC) as they age and the mechanisms for their eventual removal have been of interest for many years. Proposed age-related changes include dehydration with increased density and decreased size, increased membrane IgG, loss of membrane phospholipid asymmetry, and decreased activity of KCl cotransport. The biotin RBC label allows unambiguous identification of older cells and exploration of their properties as they age. Autologous normal human RBC were labeled ex vivo and, after reinfusion, compared with unlabeled RBC throughout their lifespan. RBC density increased with age, with most of the change in the first weeks. Near the end of their lifespan, RBC had increased surface IgG. However, there was no evidence for elevated external phosphatidylserine (PS) even though older RBC had significantly lower activity of aminophospholipid translocase (APLT). KCl cotransport activity persisted well past the reticulocyte stage, but eventually decreased as the RBC became older. These studies place limitations on the use of density fractionation for the study of older human RBC, and do not support loss of phospholipid asymmetry as a mechanism for human RBC senescence. However, increased levels of IgG were associated with older RBC, and may contribute to their removal from the circulation.
Copyright © 2012 Wiley Periodicals, Inc.
Conflict of interest statement
Conflict of interest: Nothing to report
Figures
Similar articles
-
Aminophospholipid translocase and phospholipid scramblase activities in sickle erythrocyte subpopulations.Br J Haematol. 2009 Aug;146(4):447-55. doi: 10.1111/j.1365-2141.2009.07760.x. Epub 2009 Jun 22. Br J Haematol. 2009. PMID: 19549270
-
Prolonged storage of red blood cells affects aminophospholipid translocase activity.Vox Sang. 2006 Oct;91(3):244-51. doi: 10.1111/j.1423-0410.2006.00822.x. Vox Sang. 2006. PMID: 16958837
-
Colocalization of Rh polypeptides and the aminophospholipid transporter in dilauroylphosphatidylcholine-induced erythrocyte vesicles.Biochim Biophys Acta. 1995 Apr 12;1235(1):147-54. doi: 10.1016/0005-2736(94)00305-9. Biochim Biophys Acta. 1995. PMID: 7718602
-
Hemoglobin redox reactions and red blood cell aging.Antioxid Redox Signal. 2013 Jun 10;18(17):2274-83. doi: 10.1089/ars.2012.4867. Epub 2012 Nov 9. Antioxid Redox Signal. 2013. PMID: 23025272 Free PMC article. Review.
-
[Critical role of phosphatidylserine in hemolysis due to red blood cell enzyme/membrane defects].Nihon Rinsho. 2008 Mar;66(3):461-8. Nihon Rinsho. 2008. PMID: 18330023 Review. Japanese.
Cited by
-
The Effect of Covalently-Attached ATRP-Synthesized Polymers on Membrane Stability and Cytoprotection in Human Erythrocytes.PLoS One. 2016 Jun 22;11(6):e0157641. doi: 10.1371/journal.pone.0157641. eCollection 2016. PLoS One. 2016. PMID: 27331401 Free PMC article.
-
Mathematical modeling of erythrocyte chimerism informs genetic intervention strategies for sickle cell disease.Am J Hematol. 2016 Sep;91(9):931-7. doi: 10.1002/ajh.24449. Epub 2016 Jul 14. Am J Hematol. 2016. PMID: 27299299 Free PMC article.
-
The relationship between red cell distribution width and all-cause and cause-specific mortality in a general population.Sci Rep. 2019 Nov 7;9(1):16208. doi: 10.1038/s41598-019-52708-2. Sci Rep. 2019. PMID: 31700048 Free PMC article.
-
On the Mechanism of Human Red Blood Cell Longevity: Roles of Calcium, the Sodium Pump, PIEZO1, and Gardos Channels.Front Physiol. 2017 Dec 12;8:977. doi: 10.3389/fphys.2017.00977. eCollection 2017. Front Physiol. 2017. PMID: 29311949 Free PMC article. Review.
-
Post-transfusion biotin-labeled red blood cell survival studies in pediatric sickle cell disease with antibodies of uncertain significance.Transfusion. 2024 May;64(5):800-807. doi: 10.1111/trf.17800. Epub 2024 Mar 20. Transfusion. 2024. PMID: 38506450 Free PMC article.
References
-
- Clark MR. Senescence of red blood cells: Progress and problems. Physiol Rev. 1988;68:503–554. - PubMed
-
- Sorette MP, Galili U, Clark MR. Comparison of serum anti-band 3 and anti-gal antibody binding to density-separated human red blood cells. Blood. 1991;77:628–636. - PubMed
-
- Galili U, Flechner I, Knyszynski A, Danon D, Rachmilewitz EA. The natural anti-alpha-galactosyl IgG on human normal senescent red blood cells. Br J Haematol. 1986;62:317–324. - PubMed
Publication types
MeSH terms
Substances
Grants and funding
LinkOut - more resources
Full Text Sources
Other Literature Sources
Miscellaneous