. 2013 Jan;15(1):41-56.
doi: 10.1093/neuonc/nos260. Epub 2012 Oct 31.

Detection of glioblastoma response to temozolomide combined with bevacizumab based on μMRI and μPET imaging reveals [18F]-fluoro-L-thymidine as an early and robust predictive marker for treatment efficacy

Affiliations

Detection of glioblastoma response to temozolomide combined with bevacizumab based on μMRI and μPET imaging reveals [18F]-fluoro-L-thymidine as an early and robust predictive marker for treatment efficacy

Aurélien Corroyer-Dulmont et al. Neuro Oncol. 2013 Jan.

Abstract

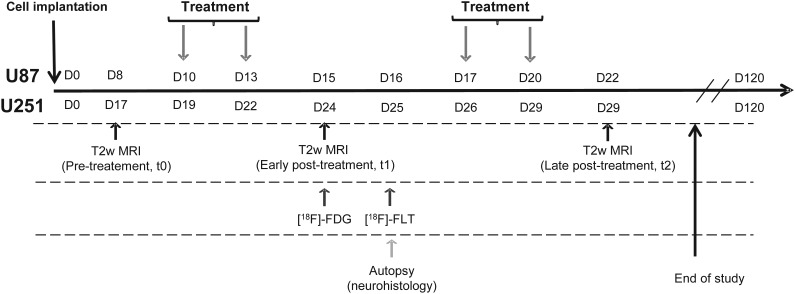
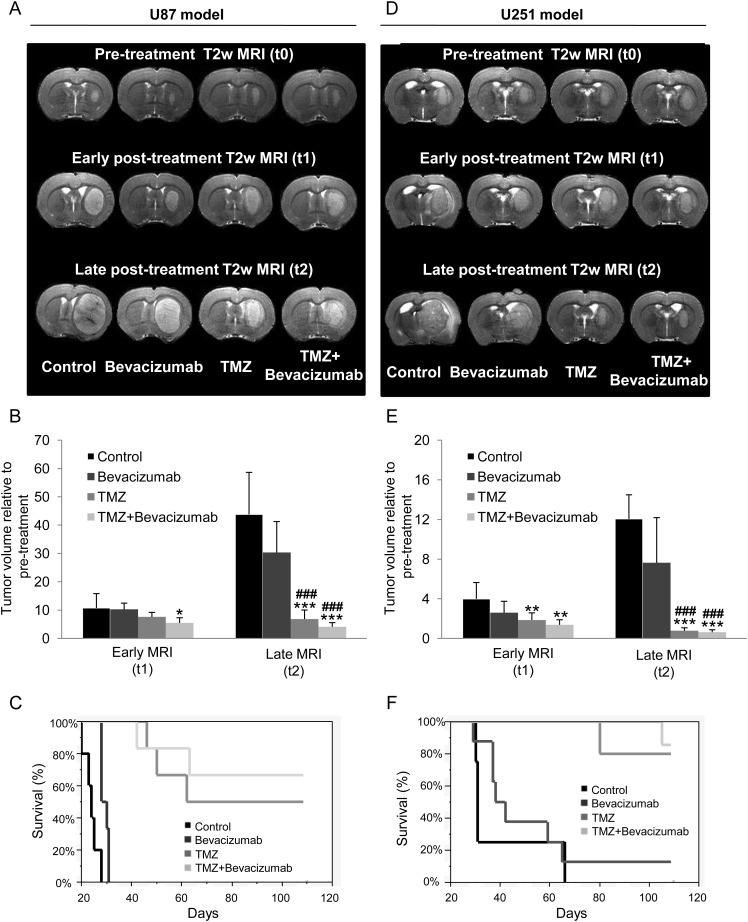
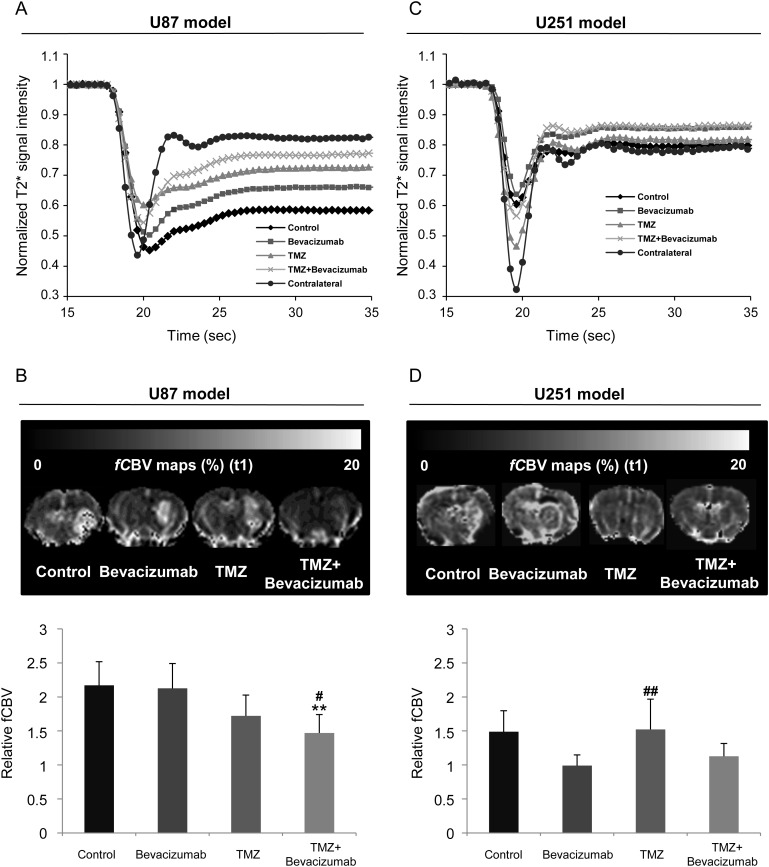
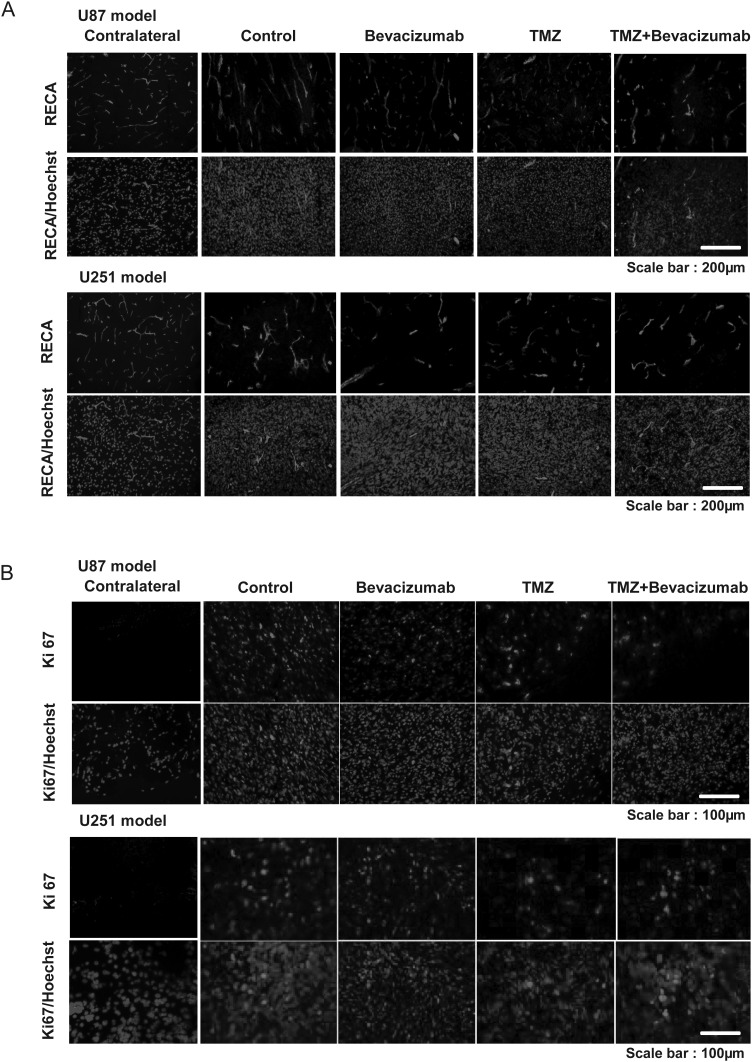
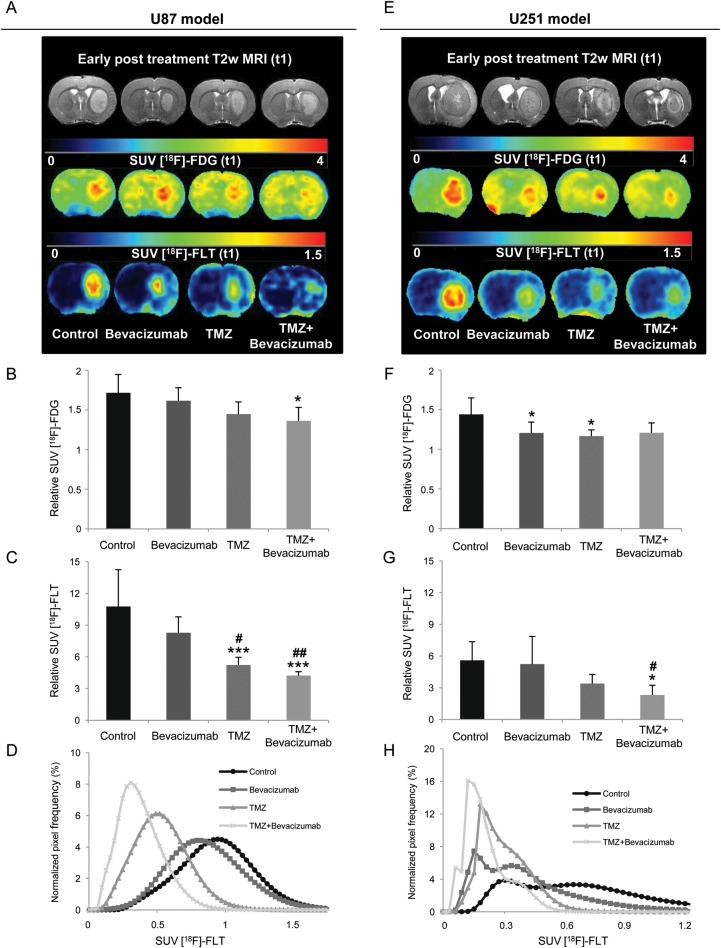
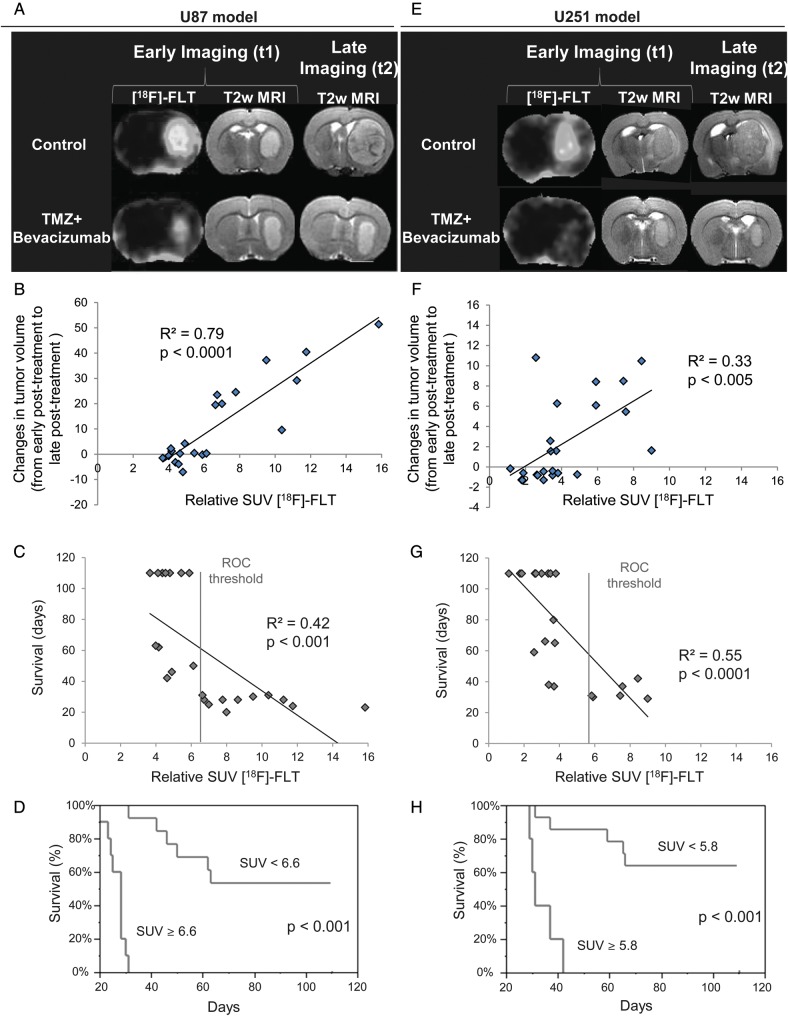
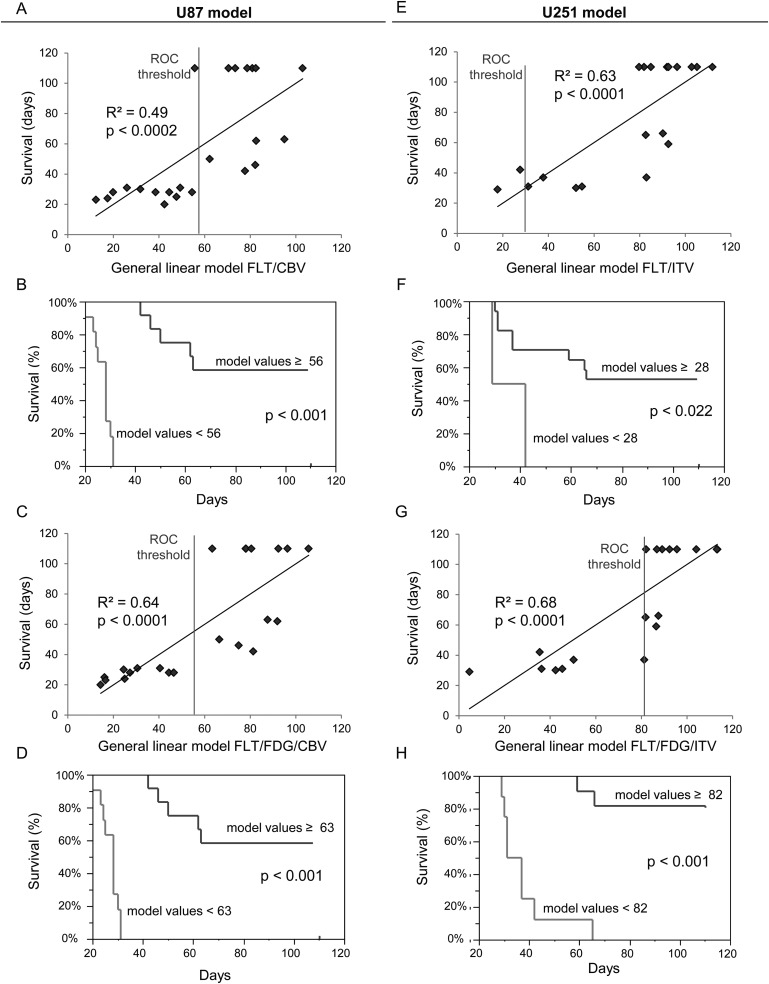
The individualized care of glioma patients ought to benefit from imaging biomarkers as precocious predictors of therapeutic efficacy. Contrast enhanced MRI and [(18)F]-fluorodeoxyglucose (FDG)-PET are routinely used in clinical settings; their ability to forecast the therapeutic response is controversial. The objectives of our preclinical study were to analyze sensitive µMRI and/or µPET imaging biomarkers to predict the efficacy of anti-angiogenic and/or chemotherapeutic regimens. Human U87 and U251 orthotopic glioma models were implanted in nude rats. Temozolomide and/or bevacizumab were administered. µMRI (anatomical, diffusion, and microrheological parameters) and µPET ([(18)F]-FDG and [(18)F]-fluoro-l-thymidine [FLT]-PET) studies were undertaken soon (t(1)) after treatment initiation compared with late anatomical µMRI evaluation of tumor volume (t(2)) and overall survival. In both models, FDG and FLT uptakes were attenuated at t(1) in response to temozolomide alone or with bevacizumab. The distribution of FLT, reflecting intratumoral heterogeneity, was also modified. FDG was less predictive for treatment efficacy than was FLT (also highly correlated with outcome, P < .001 for both models). Cerebral blood volume was significantly decreased by temozolomide + bevacizumab and was correlated with survival for rats with U87 implants. While FLT was highly predictive of treatment efficacy, a combination of imaging biomarkers was superior to any one alone (P < .0001 in both tumors with outcome). Our results indicate that FLT is a sensitive predictor of treatment efficacy and that predictability is enhanced by a combination of imaging biomarkers. These findings may translate clinically in that individualized glioma treatments could be decided in given patients after PET/MRI examinations.


Figures

Fig. 1.
Fig. 1.
Experimental paradigm and outline employing human U87 and U251 glioma models in conjunction with µMRI and µPET.
Fig. 2.
Fig. 2.
Determination of treatment effects on tumor volume and survival. (A–D) Representative T2w MRIs for the 4 different groups of animals (control, bevacizumab, TMZ, TMZ + bevacizumab) before, early (t1, 5 days), and late (t2, 12 days) after initiation of the treatments for the U87 (A) and the U251 (D) models. (B–E) Quantitative tumor volume analyses at early and late times after initiation of the treatments for the U87 (B) and the U251 (E) model. U87 model: mean ± SD, n = 6 for all groups except control (n = 7). U251 model: mean ± SD, n = 8 for bevacizumab and TMZ groups, n = 7 for TMZ + bevacizumab group, and n = 5 for control group. *P < .05 vs control group at respective time, **P < .01 vs control group at respective time, ***P < .001 vs control group at respective time, ###P < .001 vs bevacizumab group at respective time with a 1-way analysis of variance and Tukey's post hoc test. (C–F) Kaplan–Meier curves of survival for the U87 (C) and the U251 (F) model.
Fig. 3.
Fig. 3.
Early MRI determination of treatment effects on vascular measures. (A–C) Average signal of dynamic susceptibility contrast MRI over 35 s before and after a bolus injection of P904(r) in healthy contralateral caudate-putamen and in the tumor of the 4 different groups of animals for the U87 (A) and U251 (C) models. (B–D) Representative maps and corresponding quantitative analyses of fCBV for the U87 (A) and U251 (C) models. U87 model: mean ± SD, n = 6 for all groups except control (n = 7). U251 model: mean ± SD, n = 8 for bevacizumab and TMZ groups, n = 7 for TMZ + bevacizumab group, and n = 5 for control group. *P < .05, **P < .01 vs control group, and #P < .05 vs bevacizumab group with a 1-way analysis of variance and Tukey's post hoc test.
Fig. 4.
Fig. 4.
Early immunohistochemical determination of treatment effects on tumor vasculature and cell proliferation. (A) Representative images of RECA immunostaining (red) of 1 rat in each of the 4 different groups with Hoechst 33342 counterstaining (blue) for the U87 and U251 models. Scale bar = 200 µm. (B) Representative images of Ki67 immunostaining (red) of 1 rat in each of the 4 different groups with Hoechst 33342 counterstaining (blue) for the U87 (A) and U251 (B) models. Scale bar = 100 µm.
Fig. 5.
Fig. 5.
Early PET determination of treatment effects on glucose metabolism and cell proliferation. (A–E) Representative images of FDG and FLT uptake for the 4 different groups of animals for the U87 (A) and U251 (E) models. (B–F) Quantitative relative FDG–SUV uptake (relative to contralateral uptake) for the U87 (B) and U251 (F) models. (C–G) Quantitative relative FLT–SUV (relative to contralateral uptake) for U87 (C) and U251 (G) tumors. U87 model: mean ± SD, n = 6 for all groups except control (n = 7). U251 model: mean ± SD, n = 8 for bevacizumab and TMZ groups, n = 7 for TMZ + bevacizumab group, and n = 5 for control group.*P < .05 vs control group. *P < .05 vs control group, **P < .01 vs control group, ***P < .001 vs control group, and #P < .05 vs bevacizumab group. ##P < .01 vs bevacizumab group, ###P < .001 vs bevacizumab group with a 1-way analysis of variance and Tukey's post hoc test. (D–H) Normalized FLT–SUV distribution histograms. Each histogram represents the mean histogram of all animals of each treatment group for the U87 (D) and U251 (H) models.
Fig. 6.
Fig. 6.
Predictive value of imaging biomarkers. (A–E) Representative early FLT–SUV and T2w MRIs (t1) with the corresponding late T2w MRI (t2) for the U87 (A) and U251 (E) models. (B–F) Correlation graphs between relative FLT uptake and the slope of tumor volume evolution between early post-treatment (t1) and late post-treatment (t2) times (C) and between relative FLT uptake and overall survival (G) across models and treatments. (E–F) Kaplan–Meier survival curves for survival according to a cutoff value derived from the area under the ROC curve for FLT–SUV for U87 (E) and U251 (F) tumor types.
Fig. 7.
Fig. 7.
Predictive value of a combination of imaging biomarkers. (A–E) Correlation graphs between a combination of FLT and CBV for the U87 model (A) and FLT and VSI for the U251 model (E) and overall survival. (B–F) Kaplan–Meier survival curves according to a cutoff value derived from the area under the ROC curve for the combination of FLT–SUV and CBV for the U87 model (B) or FLT–SUV and VSI CBV for the U87 model (F). (C–G) Correlations between a combination of overall survival and FLT, FDG, and CBV for the U87 model (C) and FLT, FDG, and VSI for the U251 model (G). (D–H) Kaplan–Meier survival curves according to a cutoff value derived from the area under the ROC curve for the combination of SUV–FLT/SUV–FDG/CBV for the U87 model (D) and FLT–SUV/FDG–SUV/VSI for the U251 (H) model.

References

    1. Stupp R, Mason WP, van den Bent MJ, et al. Radiotherapy plus concomitant and adjuvant temozolomide for glioblastoma. N Engl J Med. 2005;352:987–996. - PubMed
    1. Desjardins A, Friedman HS. Neuro-oncology: glioblastoma-community adjusts to new standard of care. Nat Rev Neurol. 2012;8:244–246. - PubMed
    1. Jain RK, di Tomaso E, Duda DG, Loeffler JS, Sorensen AG, Batchelor TT. Angiogenesis in brain tumours. Nat Rev Neurosci. 2007;8:610–622. - PubMed
    1. Miletic H, Niclou SP, Johansson M, Bjerkvig R. Anti-VEGF therapies for malignant glioma: treatment effects and escape mechanisms. Expert Opin Ther Targets. 2009;13:455–468. - PubMed
    1. Thompson EM, Frenkel EP, Neuwelt EA. The paradoxical effect of bevacizumab in the therapy of malignant gliomas. Neurology. 2011;76:87–93. - PMC - PubMed

Publication types

MeSH terms