. 2013 Feb 7;121(6):905-17.
doi: 10.1182/blood-2012-03-416503. Epub 2012 Oct 31.

Divergent effects of supraphysiologic Notch signals on leukemia stem cells and hematopoietic stem cells

Affiliations

Divergent effects of supraphysiologic Notch signals on leukemia stem cells and hematopoietic stem cells

Mark Y Chiang et al. Blood. .

Abstract

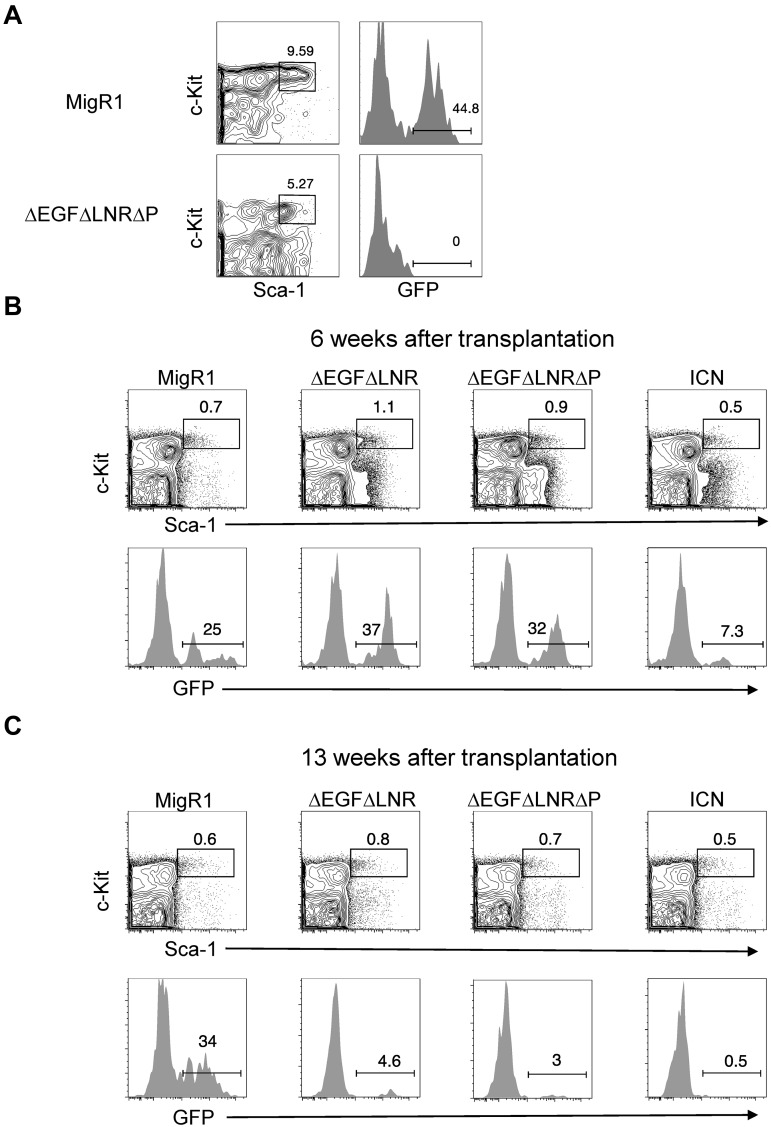
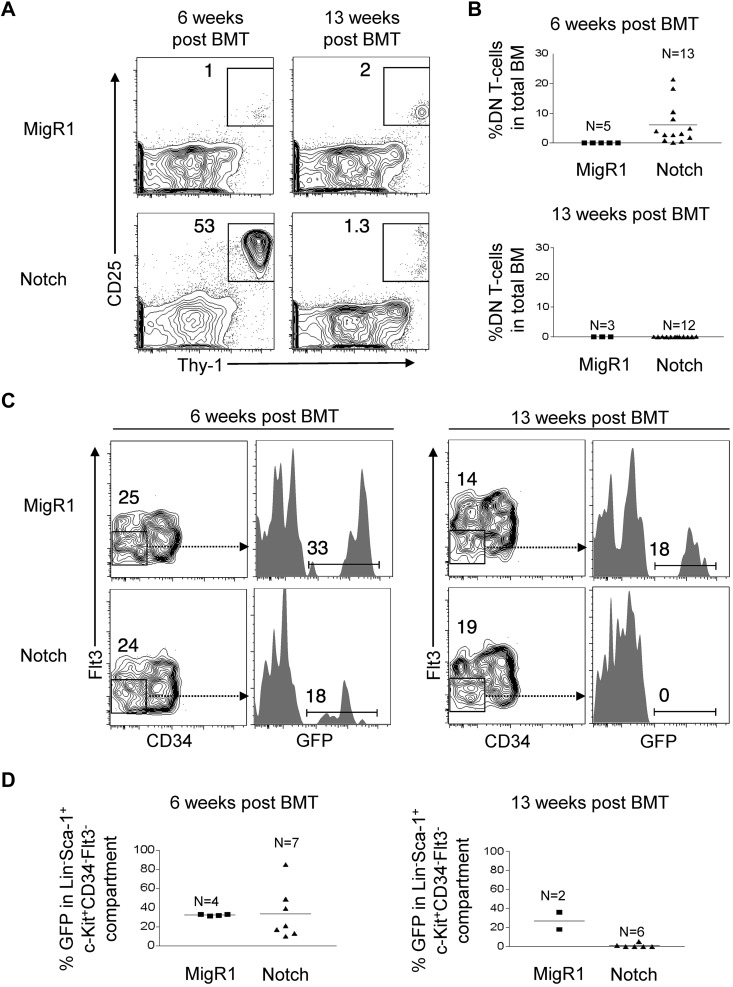
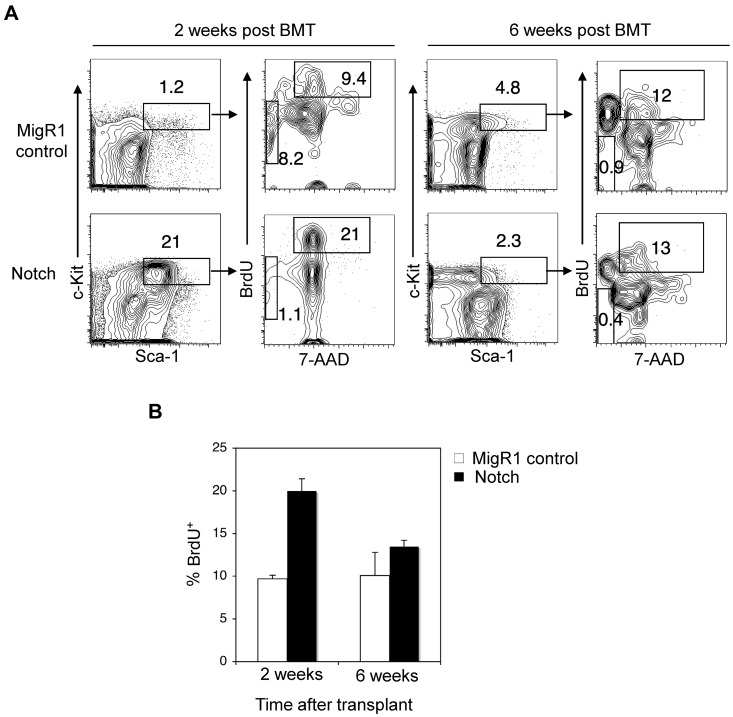
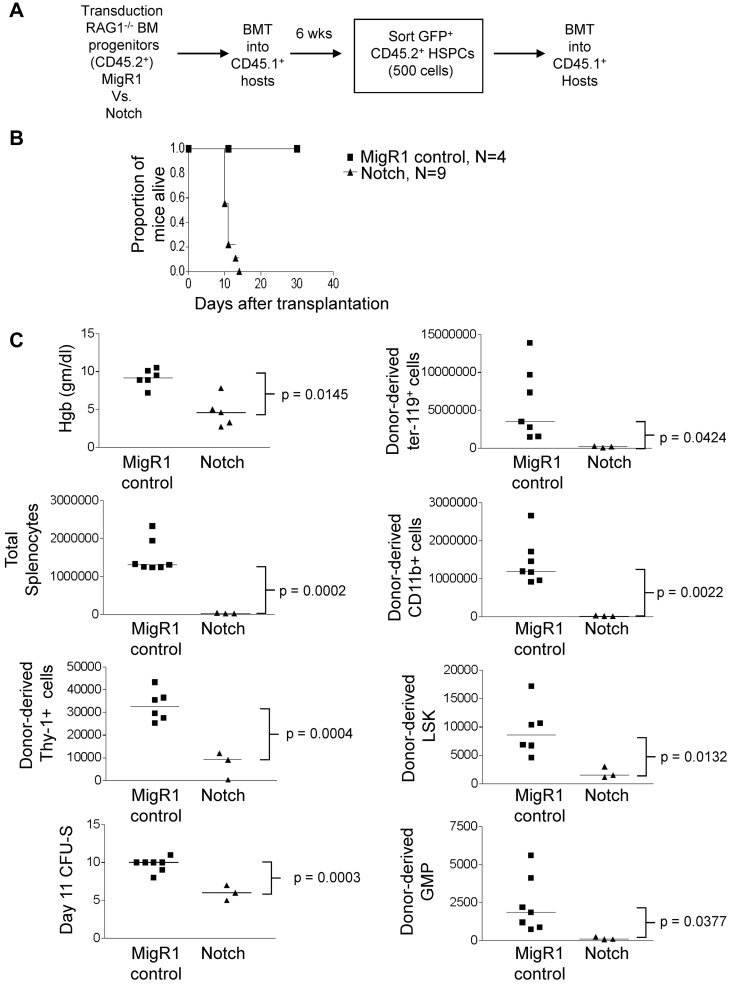
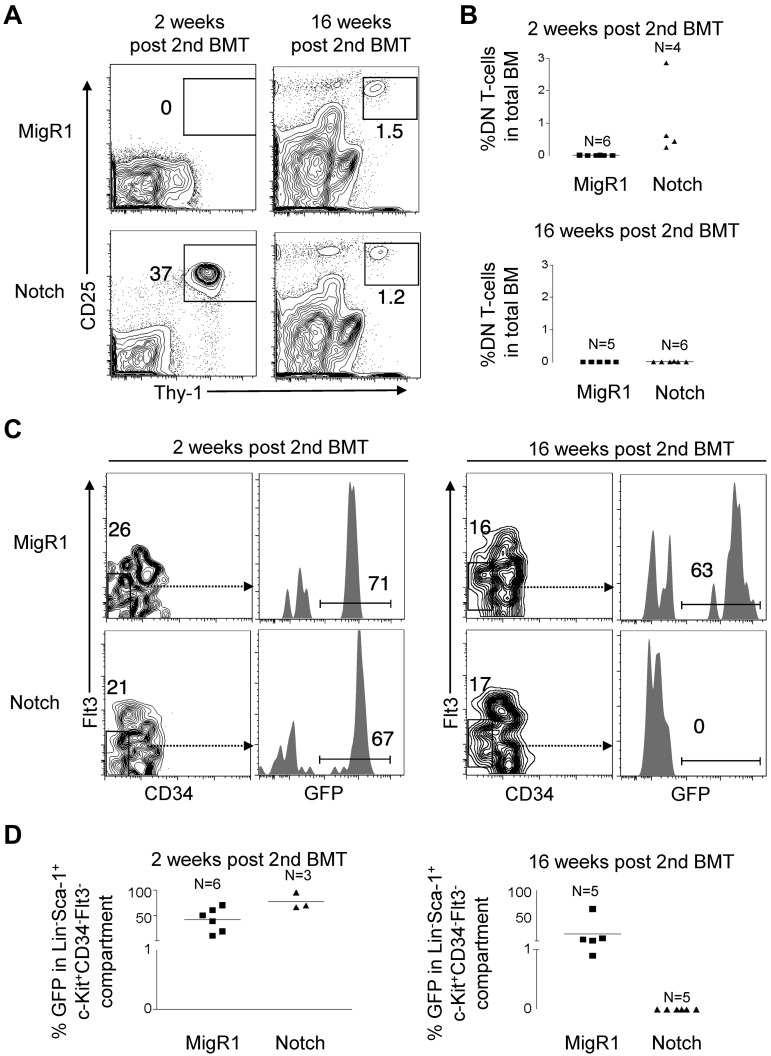
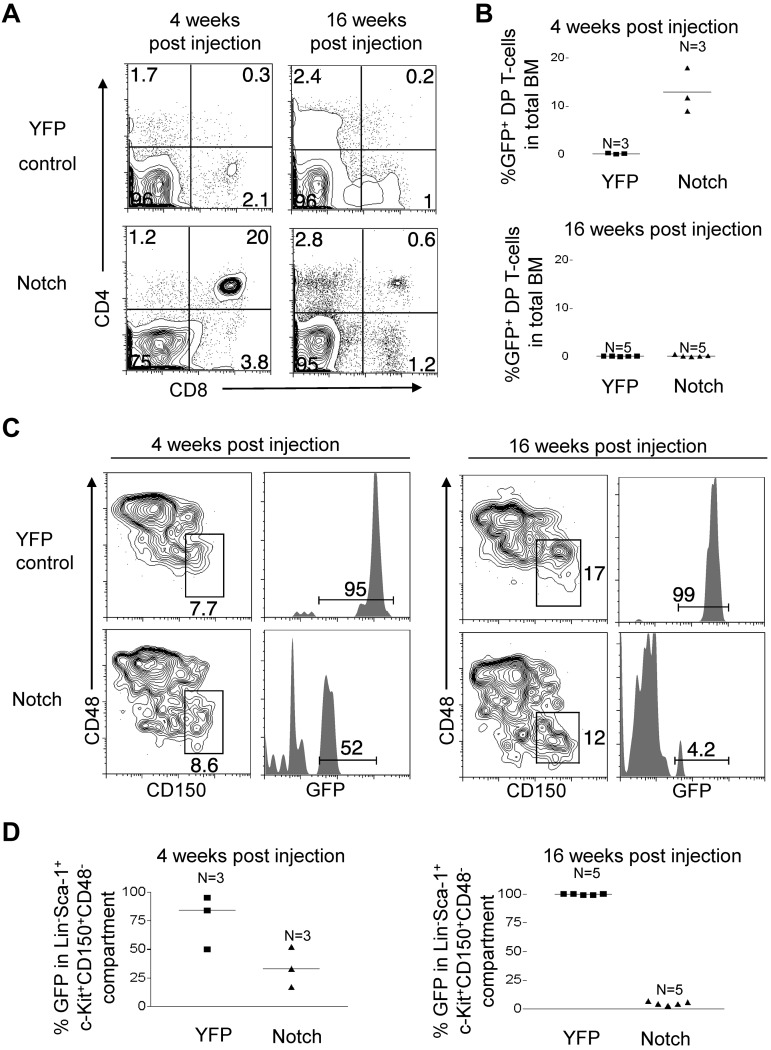
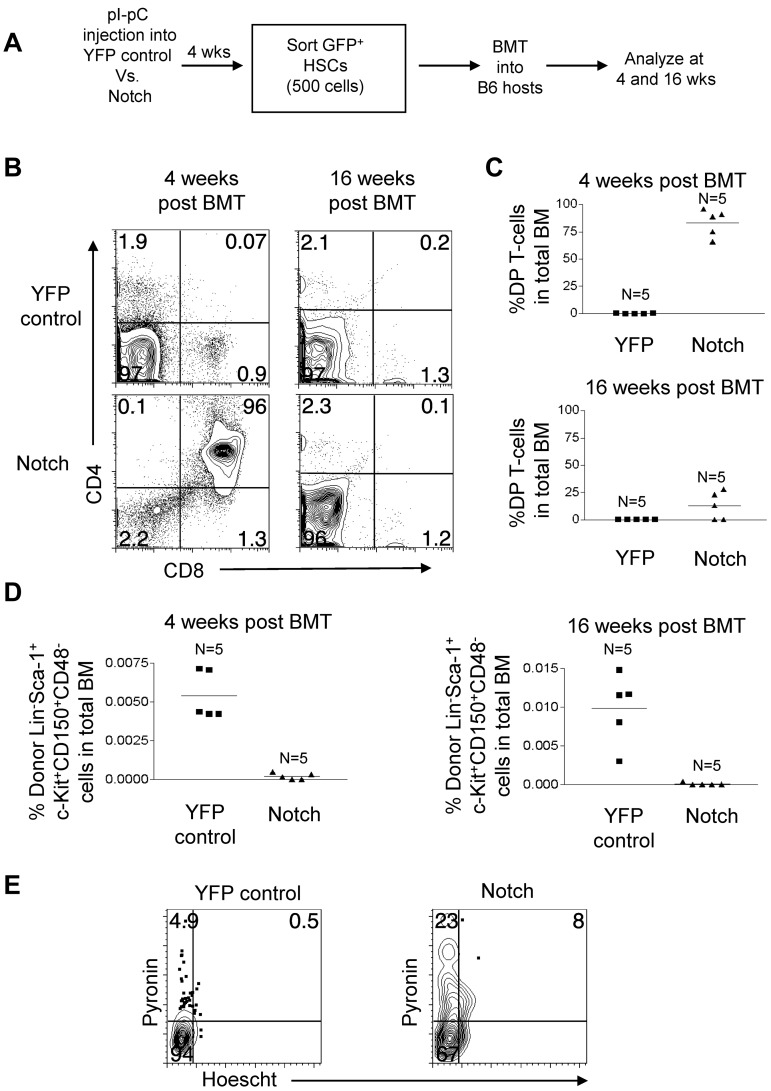
The leukemia stem cell (LSC) hypothesis proposes that a subset of cells in the bulk leukemia population propagates the leukemia.We tested the LSC hypothesis in a mouse model of Notch-induced T-cell acute lymphoblastic leukemia (T-ALL) in which the tumor cells were largely CD4+ CD8+ T cells. LSC activity was enriched but rare in the CD8+ CD4 HSA(hi) immature single-positive T-cell subset. Although our murine T-ALL model relies on transduction of HSCs, we were unable to isolate Notch-activated HSCs to test for LSC activity. Further analysis showed that Notch activation in HSCs caused an initial expansion of hematopoietic and T-cell progenitors and loss of stem cell quiescence, which was followed by progressive loss of long-term HSCs and T-cell production over several weeks. Similar results were obtained in a conditional transgenic model in which Notch activation is induced in HSCs by Cre recombinase. We conclude that although supraphysiologic Notch signaling in HSCs promotes LSC activity in T-cell progenitors, it extinguishes self-renewal of LT-HSCs. These results provide further evidence for therapeutically targeting T-cell progenitors in T-ALL while also underscoring the need to tightly regulate Notch signaling to expand normal HSC populations for clinical applications.


Figures

Figure 1
Figure 1
Weak, nonleukemogenic Notch alleles and strong, leukemogenic Notch alleles progressively deplete HSC activity and numbers over time. (A) Lethally irradiated mice were reconstituted with 5-FU–treated donor C57BL/6 BM cells transduced with MigR1 control or activated Notch1 (ΔEGFΔLNRΔP). BM cells at 6 weeks after transplantation were analyzed for donor-derived hematopoietic progenitor cells (GFP+LineageSca-1+c-Kit+). Representative flow cytometry plots are shown. (B-C) Lethally irradiated CD45.1+ congenic mice were reconstituted with 5-FU–treated donor Rag1−/− CD45.2+ BM cells transduced with MigR1 control or activated Notch1 alleles (ΔEGFΔLNR, ΔEGFΔLNRΔP, and ICN). At 6 weeks (B) and 13 weeks (C) after transplantation, cells were gated on the HSC compartment (LineageSca-1+c-Kit+Flt3) and analyzed for donor reconstitution (GFP+). Experiments were performed twice.
Figure 2
Figure 2
Notch progressively depletes HSC activity and numbers over time. (A) Lethally irradiated CD45.1+ congenic mice were reconstituted with 5-FU–treated donor Rag1−/−CD45.2+ BM cells transduced with MigR1 control or activated Notch1 (ΔEGFΔLNRΔP). BM DN T-cell production (Thy-1+CD25+) was measured at 6 weeks and 13 weeks after transplantation. Cells are gated on the CD45.2+GFP+Lineage cells. (B) Scatter plot analysis of DN T-cell production by MigR1 controls and Notch mice at 6 and 13 weeks after transplantation. (C) The LT-HSC compartment (LineageSca-1+c-Kit+CD34Flt3) was measured for donor reconstitution by GFP+ MigR1 control and Notch-activated HSCs at 6 and 13 weeks after transplantation. (D) Scatter plot analysis of donor-derived (GFP+) HSCs (LineageSca-1+c-Kit+CD34Flt3) at 6 and 13 weeks after transplantation. Experiments were performed 3 times.
Figure 3
Figure 3
HSPCs are transiently driven into cell cycle by Notch signaling. (A) Lethally irradiated mice were reconstituted with 5-FU–treated donor Rag1−/− BM cells transduced with MigR1 control or activated Notch1. At 2 weeks and 6 weeks after transplantation, the mice were injected with BrdU and then killed 16 hours later. (A) The donor-derived BM HSPC compartment (GFP+LineageSca-1+c-Kit+) was stained with 7-AAD and intracellular antibody against BrdU. Cells entering cell cycle are BrDU+ with 2N DNA content by 7-AAD stain. Apoptotic cells are BrdU and found in the sub2N region of the 7-AAD stain. (B) Bar graph analysis of BrdU+ MigR1 control and Notch HSPCs entering cell cycle at 2 and 6 weeks after transplantation. Three mice per condition.
Figure 4
Figure 4
Noncompetitive transplantation of Notch-activated HSPCs leads to hematopoietic failure. (A) Lethally irradiated CD45.1+ congenic mice were reconstituted with 5-FU–treated donor CD45.2+Rag1−/− BM cells transduced with MigR1 control or activated Notch1. At 6 weeks after transplantation, CD45.2+GFP+LineageSca-1+c-Kit+ cells (HSPCs) were sorted and transplanted into CD45.1+ hosts at 500 cells per mouse. (B) Kaplan-Meier graph showing the proportion of mice alive after transplantation. (C) Scatter plot analysis of moribund mice at 11 days after transplantation showing peripheral blood hemoglobin concentration; absolute numbers of total donor-derived (CD45.2+GFP+) splenocytes, splenic ter119+ erythroid cells, splenic CD11b+ myeloid cells, Thy-1+ T cells, splenic LineageSca-1+c-Kit+ HSPCs, and splenic LineageSca-1c-Kit+CD34+CD16/62hi granulocyte-macrophage progenitors (GMPs); and day 11 CFU-S colonies. The experiment was performed twice; 4 mice for MigR1 and 9 mice for activated Notch1.
Figure 5
Figure 5
Competitive transplantation of Notch-activated HSPCs leads to progressive exhaustion of HSC activity and numbers. A similar experiment was performed as in Figure 4A but with the addition of 200 000 whole CD45.1+ BM cells to prevent mortality from hematopoietic failure. (A) BM DN T-cell production (Thy-1+CD25+) in MigR1 control and Notch mice was measured in the BM at 2 and 16 weeks after transplantation. (B) Scatter plot analysis of DN T-cell production by MigR1 controls and Notch mice at 2 and 16 weeks after transplantation. (C) The LT-HSC compartment (LineageSca-1+c-Kit+CD34Flt3) was measured for donor reconstitution by GFP+ MigR1 control and Notch-activated LT-HSCs at 2 and 16 weeks after transplantation. (D) Scatter plot analysis of donor-derived (GFP+) LT-HSCs (LineageSca-1+c-Kit+CD34Flt3) at 2 and 16 weeks after transplantation. Experiment was performed 3 times. MigR1, 6 mice at 2 weeks; 5 mice at 16 weeks. Notch, 3 mice at 2 weeks; 6 mice at 16 weeks.
Figure 6
Figure 6
Notch progressively depletes LT-HSC activity and numbers over time in nontransplanted Rosa26-Flox-STOP-Flox-Notch-GFP mice. Mx-cretgRosa26-Flox-STOP-Flox-YFP control mice (“YFP control”) and Mx-cretgRosa26-Flox-STOP-Flox-ICN-GFP (“Notch”) mice were injected with pI-pC to activate YFP control and ICN-GFP, respectively in HSCs. (A) BM DP T-cell production (CD4+CD8+) by the HSC compartment was measured at 4 and 16 weeks after injection in YFP control and Notch mice. (B) Scatter plot analysis of BM DP T-cell production by YFP control and Notch mice at 4 and 16 weeks after injection. (C) The LT-HSC compartment (LineageSca-1+c-Kit+CD150+CD48) was measured for the donor-derived cells (YFP+ or GFP+) in YFP control and Notch mice at 4 and 16 weeks after injection. (D) Scatter plot analysis of donor-derived (YFP+ or GFP+) LT-HSCs (LineageSca-1+c-Kit+CD150+CD48) in YFP control and Notch mice at 4 and 16 weeks after injection. One experiment was performed; 3 mice per condition at 4 weeks and 5 mice per condition at 6 weeks.
Figure 7
Figure 7
Competitive transplantation of Notch-activated LT-HSCs from Rosa26-Flox-STOP-Flox-ICN-GFP mice leads to cell autonomous exhaustion of HSC activity and numbers. (A) Mx-cretgRosa26-Flox-STOP-Flox-YFP (“YFP control”) mice and Mx-cretgRosa26-Flox-STOP-Flox-ICN-GFP (“Notch”) mice were injected with pI-pC to activate YFP and ICN-GFP, respectively in HSCs. Then, 4 weeks later YFP+ or GFP+ LineageSca-1+c-Kit+CD150+CD48 BM cells (HSCs) were sorted and transplanted into syngeneic hosts at 500 cells per mouse along with 200 000 whole syngeneic BM cells. (B) BM DP T-cell production (CD4+CD8+) in YFP control and Notch mice was measured in the bone marrow at 4 and 16 weeks after transplantation. (C) Scatter plot analysis of DP T-cell production by YFP control and Notch mice at 4 and 16 weeks after transplantation. (D) The LT-HSC compartment (LineageSca-1+c-Kit+CD150+CD48) was measured for donor reconstitution by YFP+ control and Notch HSCs at 4 and 16 weeks after transplantation. Scatter plot analysis of donor-derived (YFP+ or Notch) LT-HSCs (LineageSca-1+c-Kit+CD150+CD48) at 4 and 16 weeks after transplantation. (E) Cell-cycle analysis was performed in sorted YFP control and Notch LT-HSCs (YFP+ or GFP+ LineageSca-1+c-Kit+CD150+CD48 BM cells). Propidium iodide+ cells were excluded. Pyronin+/Hoechst 33 342+ cells (top left quadrant) are in G1. Pyronin/Hoescht cells (bottom left quadrant) are in G0. Pyronin+/Hoechst 33 342+ cells (top right quadrant) are in S/G2/M.

References

    1. Kopan R, Ilagan MX. The canonical Notch signaling pathway: unfolding the activation mechanism. Cell. 2009;137(2):216–233. - PMC - PubMed
    1. Weng AP, Ferrando AA, Lee W, et al. Activating mutations of NOTCH1 in human T cell acute lymphoblastic leukemia. Science. 2004;306(5694):269–271. - PubMed
    1. Cox CV, Martin HM, Kearns PR, Virgo P, Evely RS, Blair A. Characterization of a progenitor cell population in childhood T-cell acute lymphoblastic leukemia. Blood. 2007;109(2):674–682. - PubMed
    1. Gerby B, Clappier E, Armstrong F, et al. Expression of CD34 and CD7 on human T-cell acute lymphoblastic leukemia discriminates functionally heterogeneous cell populations. Leukemia. 2011;25(8):1249–1258. - PubMed
    1. Tatarek J, Cullion K, Ashworth T, Gerstein R, Aster JC, Kelliher MA. Notch1 inhibition targets the leukemia-initiating cells in a Tal1/Lmo2 mouse model of T-ALL. Blood. 2011;118(6):1579–1590. - PMC - PubMed

Publication types

MeSH terms