. 2012 Dec;23(24):4820-32.
doi: 10.1091/mbc.E12-08-0577. Epub 2012 Oct 31.

Bld10/Cep135 stabilizes basal bodies to resist cilia-generated forces

Affiliations

Bld10/Cep135 stabilizes basal bodies to resist cilia-generated forces

Brian A Bayless et al. Mol Biol Cell. 2012 Dec.

Abstract

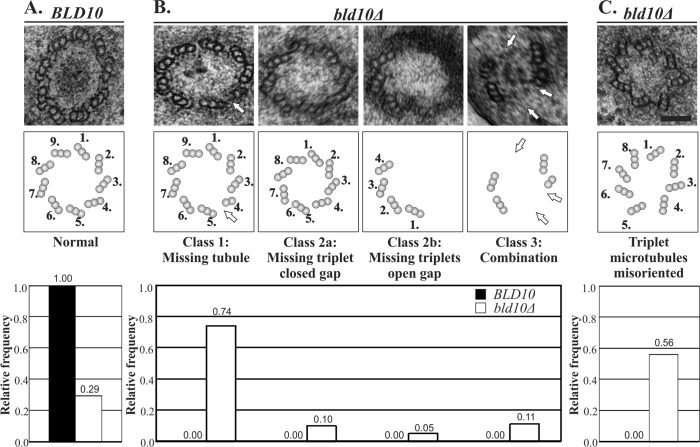
Basal bodies nucleate, anchor, and organize cilia. As the anchor for motile cilia, basal bodies must be resistant to the forces directed toward the cell as a consequence of ciliary beating. The molecules and generalized mechanisms that contribute to the maintenance of basal bodies remain to be discovered. Bld10/Cep135 is a basal body outer cartwheel domain protein that has established roles in the assembly of nascent basal bodies. We find that Bld10 protein first incorporates stably at basal bodies early during new assembly. Bld10 protein continues to accumulate at basal bodies after assembly, and we hypothesize that the full complement of Bld10 is required to stabilize basal bodies. We identify a novel mechanism for Bld10/Cep135 in basal body maintenance so that basal bodies can withstand the forces produced by motile cilia. Bld10 stabilizes basal bodies by promoting the stability of the A- and C-tubules of the basal body triplet microtubules and by properly positioning the triplet microtubule blades. The forces generated by ciliary beating promote basal body disassembly in bld10Δ cells. Thus Bld10/Cep135 acts to maintain the structural integrity of basal bodies against the forces of ciliary beating in addition to its separable role in basal body assembly.


Figures

FIGURE 1:
FIGURE 1:
TtBld10 localizes to the basal body outer cartwheel domain. (A) Both TtBld10 and TtCen1 colocalize at basal bodies. T. thermophila cells expressing TtBld10-mCherry (red) were stained for the basal body marker TtCen1 (green; Stemm-Wolf et al., 2005). (B) TtBld10-mCherry (red) localizes to the base of cilia labeled using α-tubulin antibodies (green). (C) Colocalization of TtBld10 and TtCen1 within a single basal body. Longitudinal view of TtBld10-mCherry (red) stained with basal body marker TtCen1 (green). Schematic drawing represents the known TtCen1 ultrastructural localization based on immuno–electron microscopy (Stemm-Wolf et al., 2005; green) and the predicted TtBld10 (red) localization based on its localization relative to TtCen1 (green). TtCen1 at the basal body proximal end is asymmetrically localized relative to the longitudinal axis of the basal body, and this generates an offset between TtCen1 and TtBld10 at the cartwheel. Scale bar, 10 μm (A, B), 1 μm (C). (D) IEM localization of TtBld10 at the basal body outer cartwheel domain. Micrographs of TtBld10-GFP localization in longitudinal sections through a basal body (left) at 15,500×. Right, TtBld10 localization within the cartwheel domain of cross-sectional views from the proximal end of the basal body. Arrows denote sites of TtBld10 localization. Red dots represent localization based on the relative distribution of 25 gold particles to represent the total quantified gold label. Longitudinal section, n = 254 gold particles in 90 basal bodies; cross section, n = 64 gold particles in 14 basal bodies. Numbers on schematics denote the domains used to quantify TtBld10 localization.
FIGURE 2:
FIGURE 2:
TtBLD10 knockout causes a loss of basal bodies. (A) TtBld10 is required to maintain the normal number and organization of basal bodies. Images describe a time course of basal bodies after Ttbld10Δ. Basal bodies are visualized by anti-TtCen1 staining. By 12 h after knockout, a significant number of basal bodies are diminished. The remaining basal bodies are less organized. This phenotype is exacerbated with time. Scale bar, 10 μm. (B) Ttbld10Δ phenotypes are rescued by reintroducing the TtBLD10 gene into cells. (C) The frequency of basal bodies per unit length significantly dropped after Ttbld10Δ knockout. The number of basal bodies was quantified per 10 μm in TtBLD10 control and Ttbld10Δ cells. *p < 0.0001, n = 3 separate experiments of 100 basal body rows (20 cells) for each condition.
FIGURE 3:
FIGURE 3:
TtBld10 is required for basal body assembly. (A) Fluorescence images of all basal bodies (anti-TtCen1; green) and mature basal bodies (Kl-Ag; red) in control and Ttbld10Δ cells 12 h after knockout. Newly assembled basal bodies are evident as the anteriorly positioned basal body of two closely positioned basal bodies (doublet) that is only labeled by TtCen1 (green arrows; no Kl-Ag). Mature basal bodies are posteriorly positioned and labeled with both TtCen1 and Kl-Ag. Basal body disassembly is evident by Kl-Ag–stained foci without associated TtCen1 (red arrowhead). Scale bar, 10 μm. (B) Insets are from images in A at 0 and 12 h after TtBLD10 knockout. New basal bodies are denoted with green arrows. Panel width, 2 μm. (C) The frequency of new basal body assembly decreases with time after TtBLD10 knockout. Quantification of the relative frequency of new basal body assembly after TtBld10 loss. *p < 0.0001, n = 3 separate experiments of 20 cells each, counting 50 basal bodies per cell for each condition.
FIGURE 4:
FIGURE 4:
Bld10 is necessary for the maintenance of basal bodies. (A) Basal bodies disassemble in G1 cell cycle–arrested Ttbld10Δ cells. Immunofluorescence images of cell cycle–arrested Ttbld10Δ cells stained for the basal body marker anti-TtCen1 at 0 and 12 h after TtBld10 loss. (B) The number of basal bodies temporally decreases in Ttbld10Δ but not control cells. The number of basal bodies was quantified per 10 μm in TtBLD10 control and Ttbld10Δ cells. *p < 0.0001, n = 3 separate experiments of 100 basal body rows (20 cells) for each condition. (C) Kl-Ag remains at basal bodies after basal body disassembly and marks basal body disassembly sites. Insets, G1-arrested TtBLD10 control and Ttbld10Δ cells at 0 and 12 h post–TtBLD10 knockout. Cells are stained with the basal body marker TtCen1 (green) and the mature basal body marker Kl-Ag (red). Red arrow denotes site of basal body disassembly. Inset length, 10 μm. (D) Frequency of basal body disassembly quantified at 0, 12, and 24 h. Disassembly events are identified as Kl-Ag foci without TtCen1 staining. No disassembly was observed in TtBLD10 control cells *p < 0.0001, n = 3 separate experiments of 20 cells each counting 50 basal bodies per cell for each condition.
FIGURE 5:
FIGURE 5:
Triplet microtubule assembly and stability defects in Ttbld10Δ cells. (A) Electron micrograph image of a cross-sectional view of a TtBLD10 control cell (top). Middle, representative schematic of the basal body structure. Bottom, relative frequency observed for the normal morphology class for TtBLD10 (black bars) and Ttbld10Δ (white bars) basal bodies. The relative frequency is indicated above each bar. (B) Ttbld10Δ mutant phenotypes are distributed among three classes that were observed 12 h after Ttbld10Δ knockout. Top, representative electron micrographs of basal body cross-sectional views in bld10Δ cells. Class 1 consists of basal bodies with missing tubules of the triplet microtubules where an A-, C-, A-B-, or B-C-tubule is missing. Class 2 is characterized by missing microtubule triplets through the entire length of the basal body. Class 2a contains basal bodies with missing triplet microtubule blades that do not leave a gap but reduce the basal body diameter. Class 2b contains basal bodies that have a gap at the site of the missing triplet microtubule blade. Class 3 is a combination of class 1 and class 2 phenotypes. None of the mutant phenotypes were observed in control TtBLD10 cells. Middle, schematics of the mutant phenotypes. Bottom, relative frequency observed for each mutant class. (C) The triplet microtubule blades are commonly misoriented in Ttbld10Δ mutant basal bodies at 12 h post–TtBLD10 knockout. Magnification, 30,000×. Scale bar, 0.1 μm. n = 100 basal bodies.
FIGURE 6:
FIGURE 6:
TtBld10 protein stably accumulates at basal bodies. (A) TtBld10-mCherry fluorescence intensities are low at newly formed basal bodies and increase as the daughter basal bodies separate from their mother basal bodies. The separation distance corresponds to basal body age, so that as basal bodies mature, the level of TtBld10 increases. Insets show mature TtBld10-mCherry–labeled basal bodies (top) and a newly assembled basal body (middle basal body; bottom). Arrows and arrowheads denote mature and newly formed basal bodies, respectively. Scale bar, 5 μm. (B) Quantification of the basal body–localized TtBld10-mCherry fluorescence intensity relative to the separation of newly assembled daughter basal bodies from their mature mother basal body. Fluorescence intensity is defined as the ratio between the daughter and the mother basal body fluorescence. (C) TtBld10 is a stable basal body component. FRAP of TtBld10-mCherry. A mature basal body (arrow) was photobleached, and fluorescence recovery was visualized over time. Low fluorescence recovery (<0.05) was observed, indicating that TtBld10-mCherry stably assembles at basal bodies. The relative fluorescence intensity was quantified over time. (D) TtBld10-mCherry matures to its maximum level before the basal body becomes ciliated. Arrows and arrowheads denote ciliated and unciliated basal bodies, respectively. Schematic shows that only basal bodies with full levels of TtBld10 nucleate a cilium. Scale bar, 1 μm. n = 50 basal bodies.
FIGURE 7:
FIGURE 7:
Cilia-generated forces destabilize basal bodies in Ttbld10Δ cells. (A) Ciliary inhibition rescues basal body disassembly in Ttbld10Δ. G1-arrested TtBLD10 and Ttbld10Δ cells at 12 and 24 h postknockout and treated with NiCl2 to inhibit ciliary beating. Quantification of the number of basal bodies per 10 μm is shown below for control, 12 and 24 h post–TtBLD10 knockout. Scale bar, 5 μm. n = 3 separate experiments of 100 basal body rows (20 cells) for each condition. *p < 0.001. (B) Increased viscosity of media causes an increased basal body disassembly in Ttbld10Δ. G1-arrested TtBLD10 and Ttbld10Δ cells at 24 h postknockout and treated with 5% PEO to increase the viscosity of the media. Quantification of the number of basal bodies per 10 μm is shown below. Scale bar, 5 μm. n = 3 separate experiments of 100 basal body rows (20 cells) for each condition. *p < 0.01.

Similar articles

Cited by

References

    1. Abal M, Keryer G, Bornens M. Centrioles resist forces applied on centrosomes during G2/M transition. Biol Cell. 2005;97:425–434. - PubMed
    1. Allen RD. The morphogenesis of basal bodies and accessory structures of the cortex of the ciliated protozoan Tetrahymena pyriformis. J Cell Biol. 1969;40:716–733. - PMC - PubMed
    1. Anisimova M, Gascuel O. Approximate likelihood-ratio test for branches: a fast, accurate, and powerful alternative. Syst Biol. 2006;55:539–552. - PubMed
    1. Arquint C, Sonnen KF, Stierhof YD, Nigg EA. Cell-cycle-regulated expression of STIL controls centriole number in human cells. J Cell Sci. 2012;125:1342–1352. - PubMed
    1. Bettencourt-Dias M, Hildebrandt F, Pellman D, Woods G, Godinho SA. Centrosomes and cilia in human disease. Trends Genet. 2011;27:307–315. - PMC - PubMed

Publication types

MeSH terms