. 2013 Jan 30;365(2):174-86.
doi: 10.1016/j.mce.2012.10.019. Epub 2012 Oct 29.

Testosterone regulation of Akt/mTORC1/FoxO3a signaling in skeletal muscle

Affiliations

Testosterone regulation of Akt/mTORC1/FoxO3a signaling in skeletal muscle

James P White et al. Mol Cell Endocrinol. .

Abstract

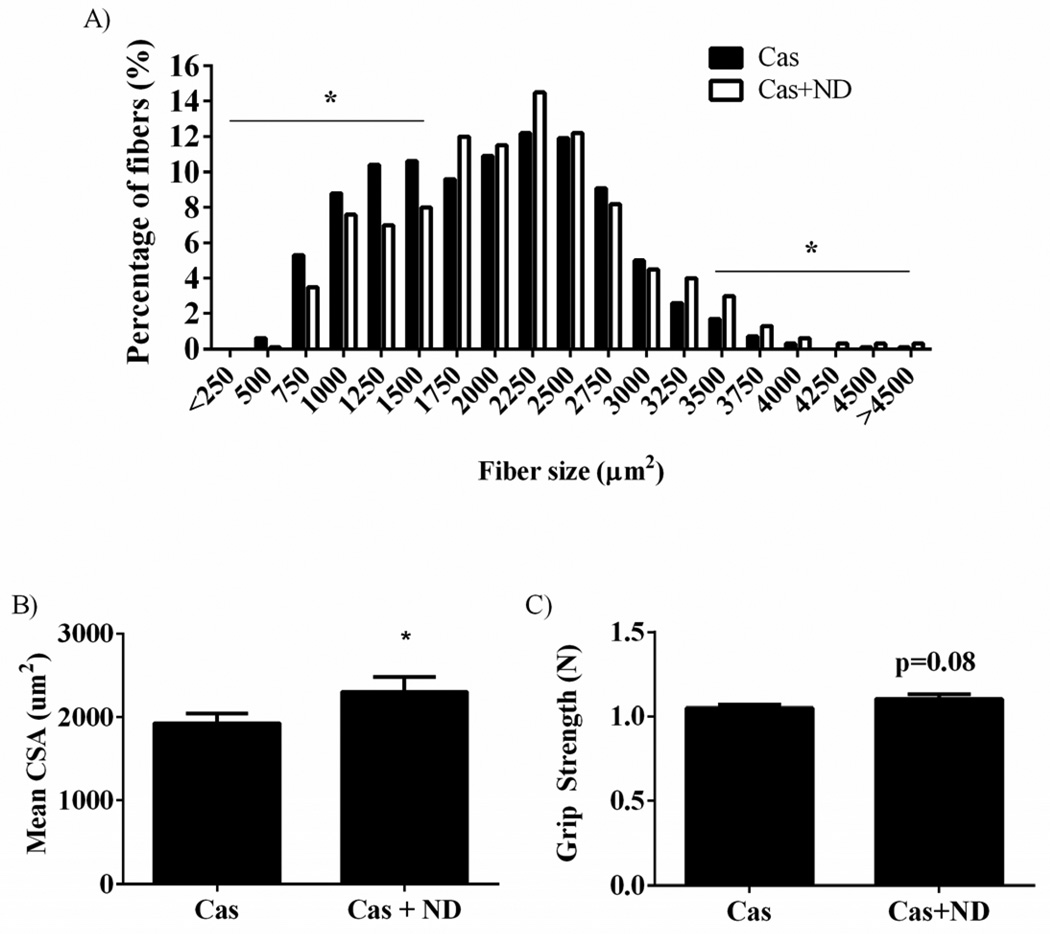
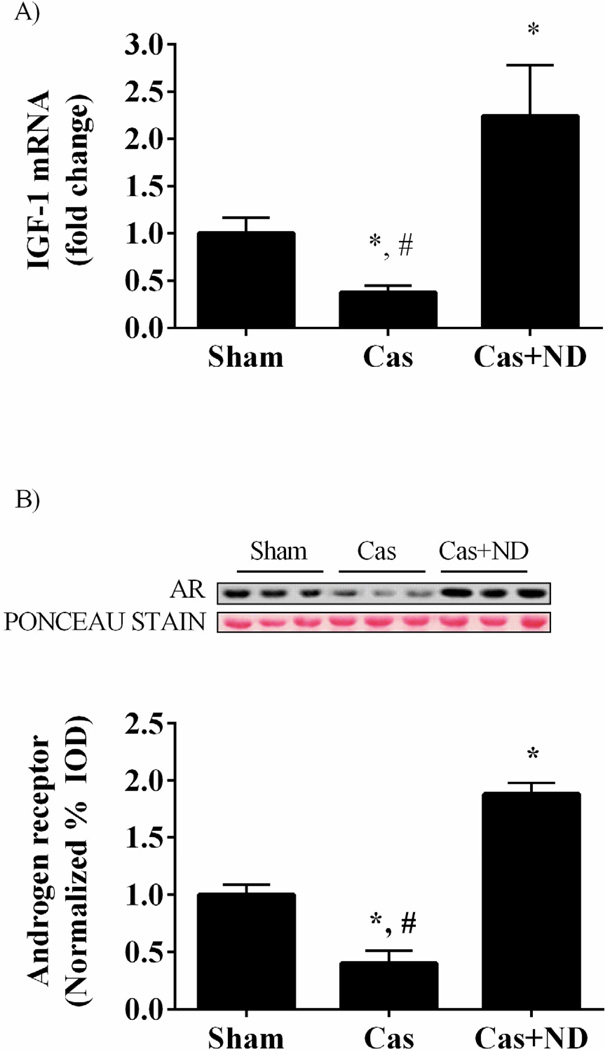
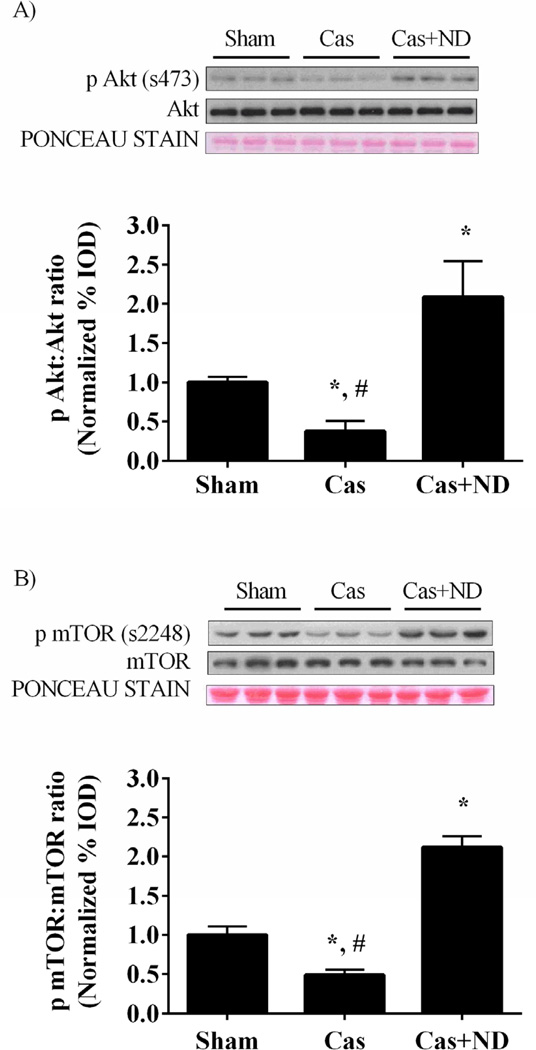
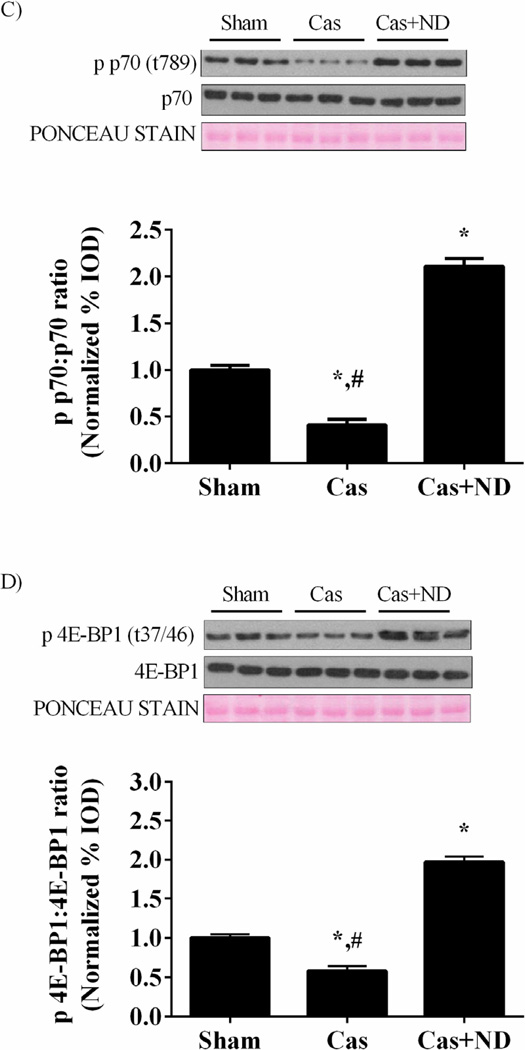
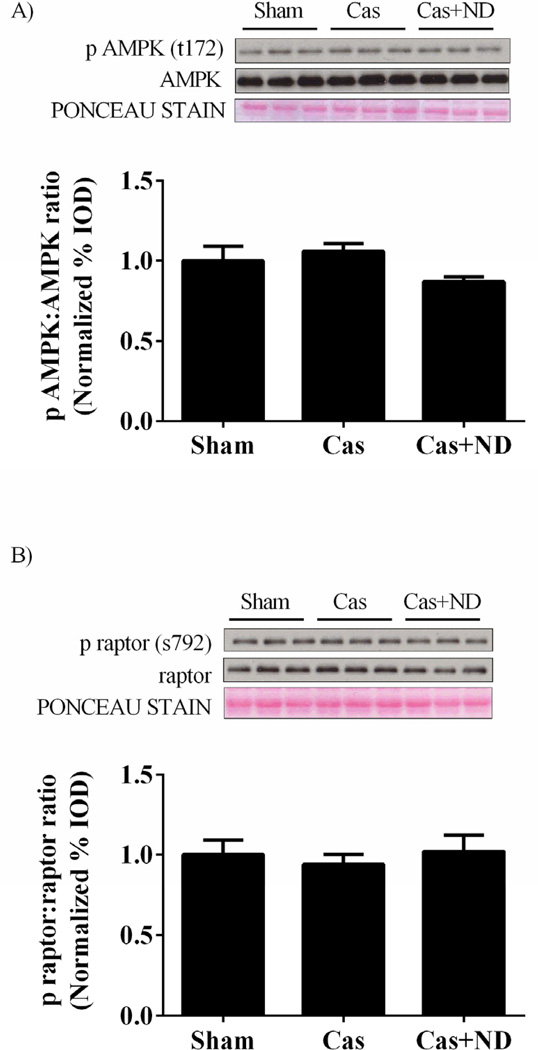
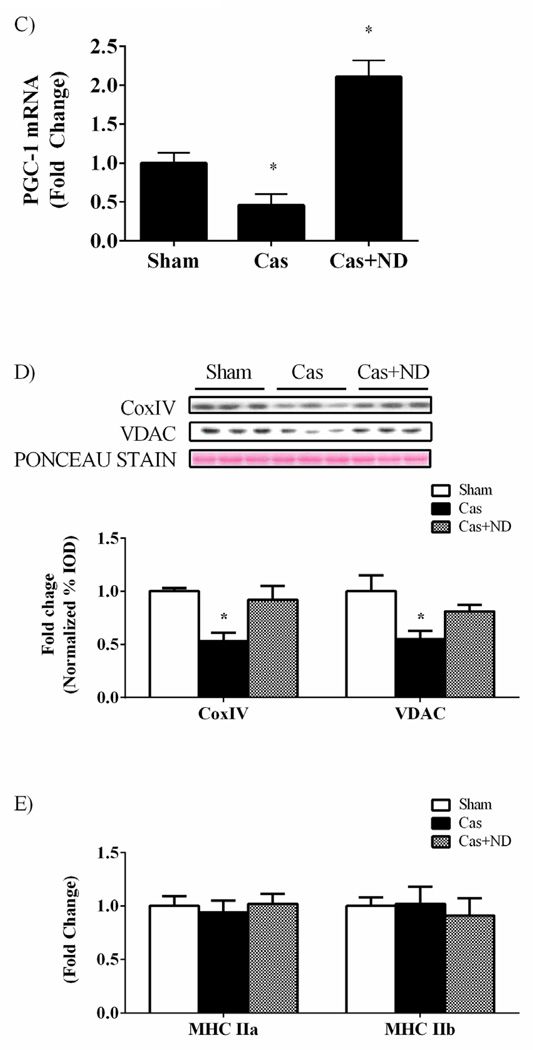
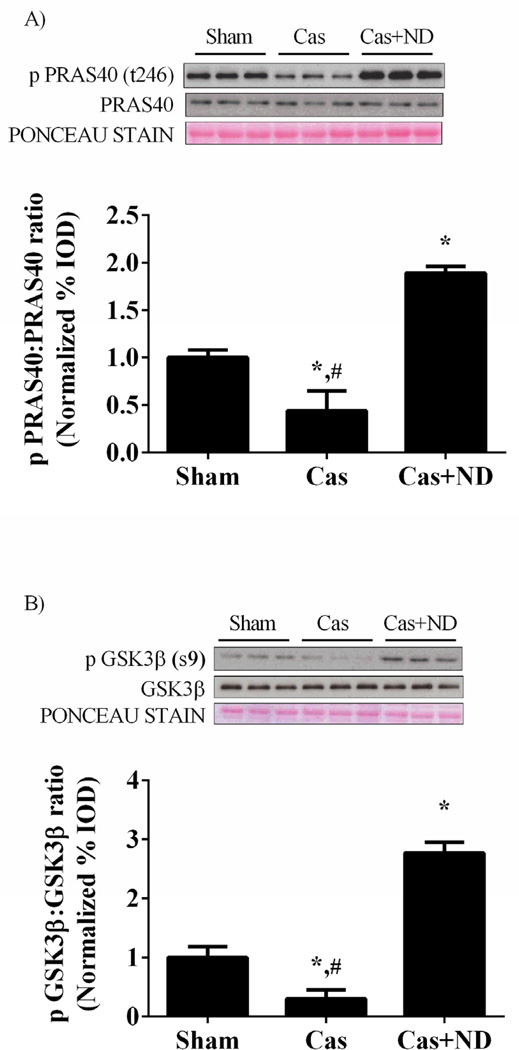
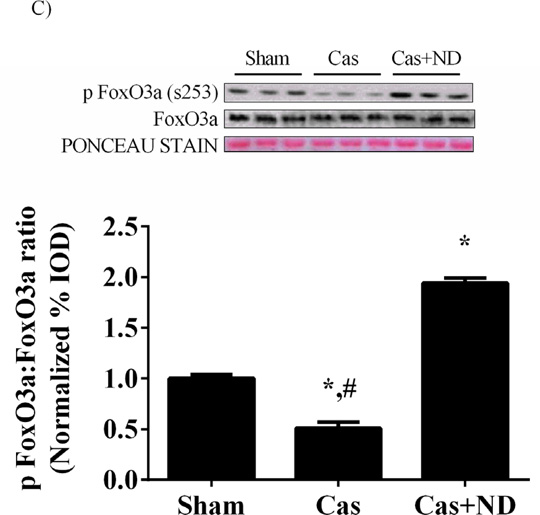
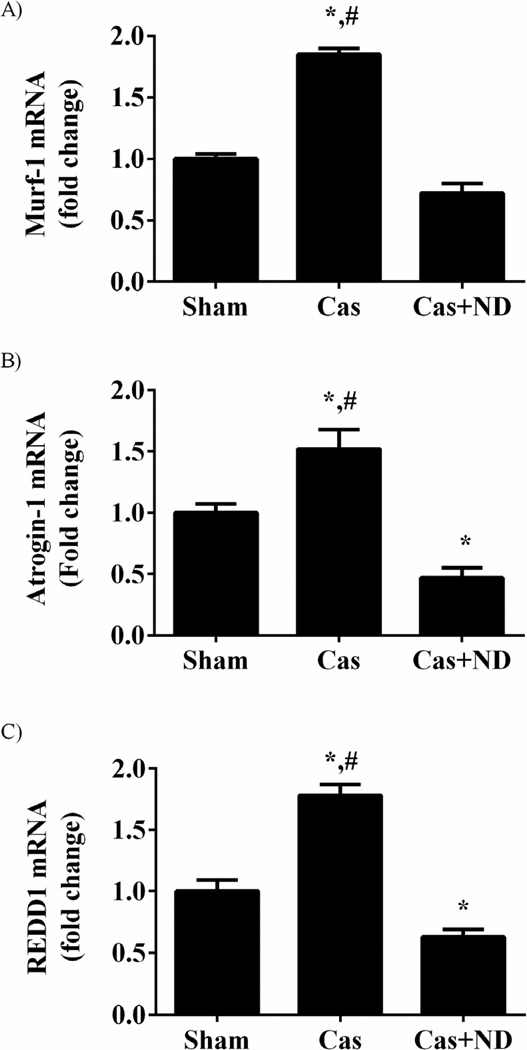
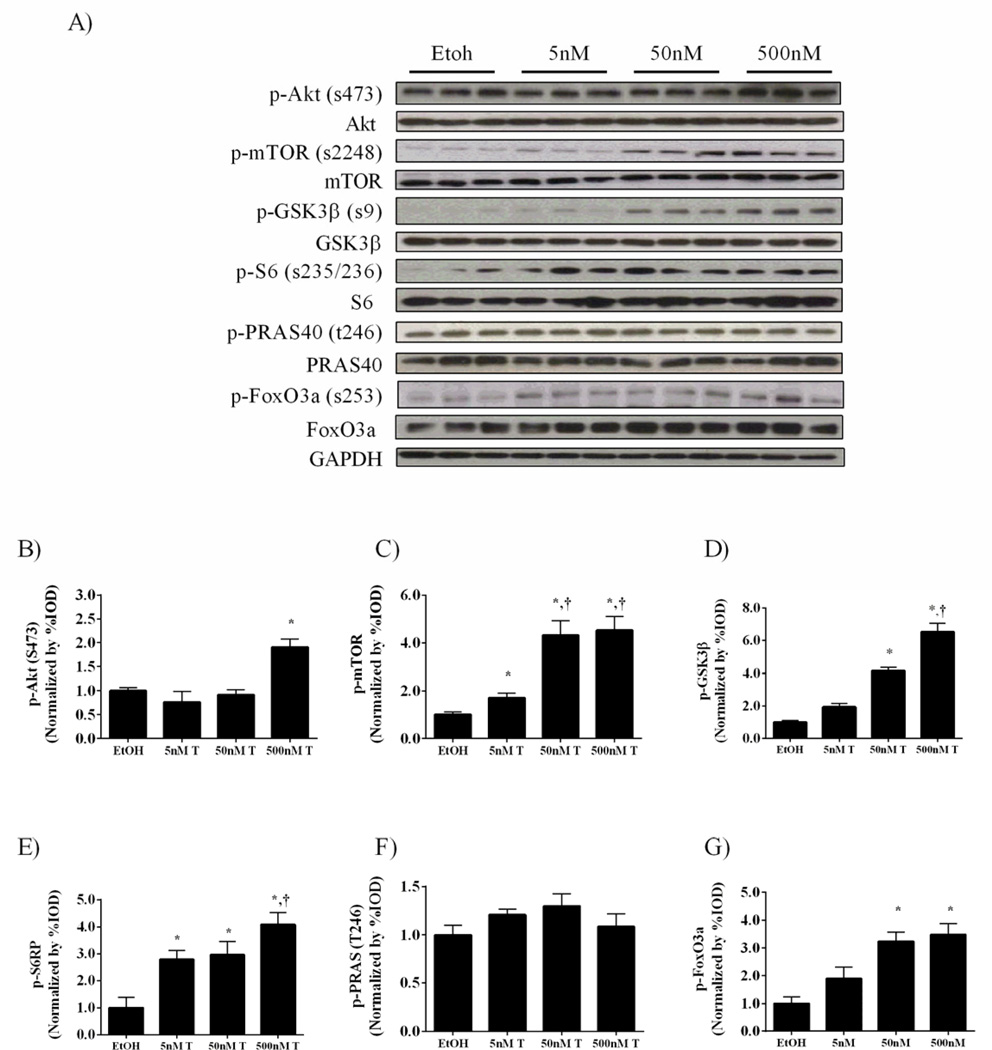
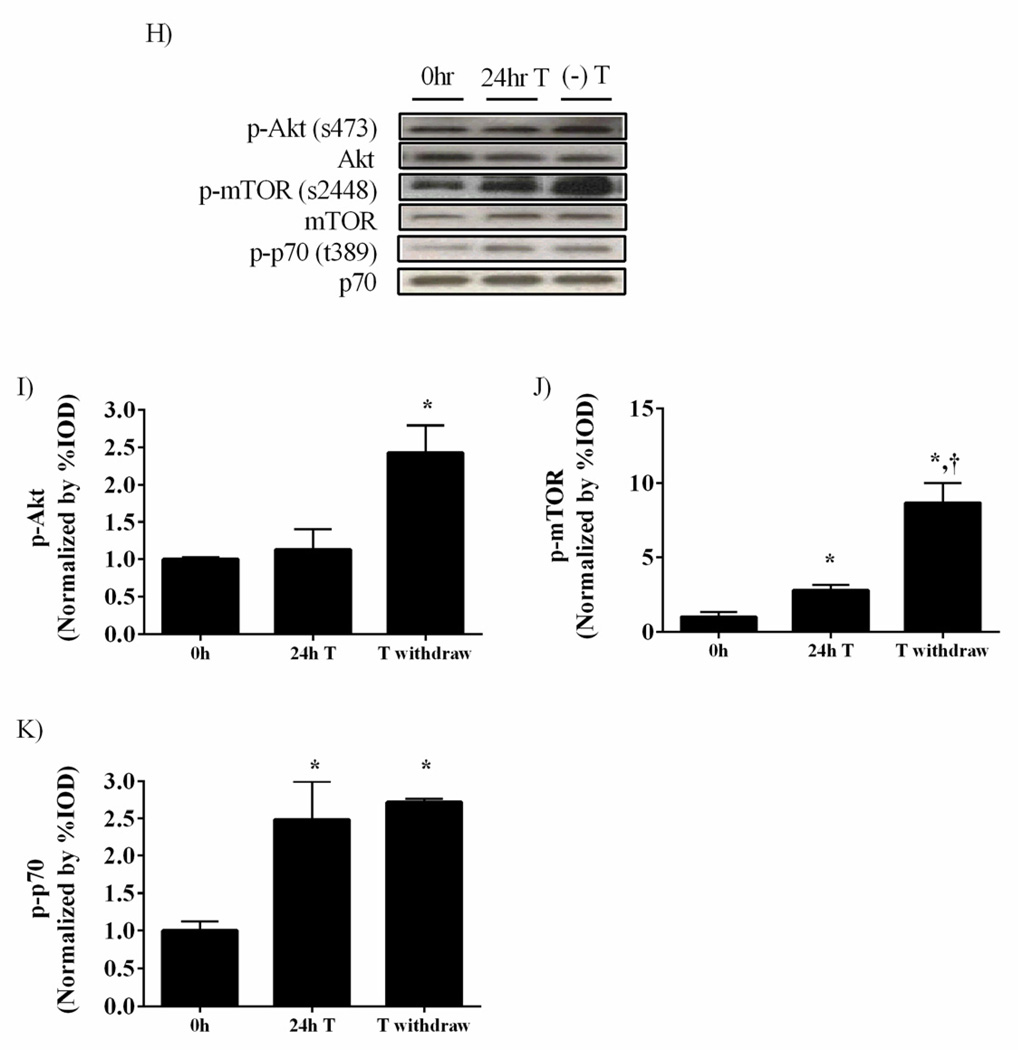
Low endogenous testosterone production, known as hypogonadism is commonly associated with conditions inducing muscle wasting. Akt signaling can control skeletal muscle mass through mTOR regulation of protein synthesis and FoxO regulation of protein degradation, and this pathway has been previously identified as a target of androgen signaling. However, the testosterone sensitivity of Akt/mTOR signaling requires further understanding in order to grasp the significance of varied testosterone levels seen with wasting disease on muscle protein turnover regulation. Therefore, the purpose of this study is to determine the effect of androgen availability on muscle Akt/mTORC1/FoxO3a regulation in skeletal muscle and cultured C(2)C(12) myotubes. C57BL/6 mice were either castrated for 42 days or castrated and treated with the nandrolone decanoate (ND) (6 mg/kg bw/wk). Testosterone loss (TL) significantly decreased volitional grip strength, body weight, and gastrocnemius (GAS) muscle mass, and ND reversed these changes. Related to muscle mass regulation, TL decreased muscle IGF-1 mRNA, the rate of myofibrillar protein synthesis, Akt phosphorylation, and the phosphorylation of Akt targets, GSK3β, PRAS40 and FoxO3a. TL induced expression of FoxO transcriptional targets, MuRF1, atrogin1 and REDD1. Muscle AMPK and raptor phosphorylation, mTOR inhibitors, were not altered by low testosterone. ND restored IGF-1 expression and Akt/mTORC1 signaling while repressing expression of FoxO transcriptional targets. Testosterone (T) sensitivity of Akt/mTORC1 signaling was examined in C(2)C(12) myotubes, and mTOR phosphorylation was induced independent of Akt activation at low T concentrations, while a higher T concentration was required to activate Akt signaling. Interestingly, low concentration T was sufficient to amplify myotube mTOR and Akt signaling after 24 h of T withdrawal, demonstrating the potential in cultured myotubes for a T initiated positive feedback mechanism to amplify Akt/mTOR signaling. In summary, androgen withdrawal decreases muscle myofibrillar protein synthesis through Akt/mTORC1 signaling, which is independent of AMPK activation, and readily reversible by anabolic steroid administration. Acute Akt activation in C(2)C(12) myotubes is sensitive to a high concentration of testosterone, and low concentrations of testosterone can activate mTOR signaling independent of Akt.


Figures

Figure 1
Figure 1
Castration decreases muscle cross sectional area, protein synthesis and functional performance in mice. A) Muscle fiber frequency distribution. B) Mean fiber area. C) Myofibrillar rate of protein synthesis. D) Grip strength. Values are means ± SE. Significance was set at p<0.05. *Signifies different from Sham group.
Figure 2
Figure 2
Nandrolone decanoate administration returns muscle fiber area and functional performance in mice. A) Muscle fiber frequency distribution. B) Mean fiber area. C) Grip strength. Values are means ± SE. Significance was set at p<0.05. *Signifies different from Cas group.
Figure 3
Figure 3
IGF-1 gene expression and AR protein expression in castrated gastrocnemius muscle. Data are normalized to Sham group. Values are means ± SE. Significance was set at p<0.05. *Signifies difference from Sham group. # Signifies difference from Cas+ND group.
Figure 4
Figure 4
Akt/mTORC1 signaling in castrated gastrocnemius muscle. A) Upper: representative western blot of phosphorylated and total forms of Akt (Ser 473). Lower: The ratio of phosphorylated and total Akt in the gastrocnemius muscle normalized to the Sham group. B) Upper: representative western blot of phosphorylated and total forms of mTOR (Ser2448). Lower: The ratio of phosphorylated and total mTOR. C) Upper: representative western blot of phosphorylated and total forms of p70S6K (Thr389). Lower: The ratio of phosphorylated and total p70S6K. D) Upper: representative western blot of phosphorylated and total forms of 4E-BP1 (Thr37/46). Lower: The ratio of phosphorylated and total 4E-BP1 normalized to the Sham group. Values are means ± SE. Significance was set at p<0.05. *Signifies difference from Sham group. # Signifies difference from Cas+ND group.
Figure 4
Figure 4
Akt/mTORC1 signaling in castrated gastrocnemius muscle. A) Upper: representative western blot of phosphorylated and total forms of Akt (Ser 473). Lower: The ratio of phosphorylated and total Akt in the gastrocnemius muscle normalized to the Sham group. B) Upper: representative western blot of phosphorylated and total forms of mTOR (Ser2448). Lower: The ratio of phosphorylated and total mTOR. C) Upper: representative western blot of phosphorylated and total forms of p70S6K (Thr389). Lower: The ratio of phosphorylated and total p70S6K. D) Upper: representative western blot of phosphorylated and total forms of 4E-BP1 (Thr37/46). Lower: The ratio of phosphorylated and total 4E-BP1 normalized to the Sham group. Values are means ± SE. Significance was set at p<0.05. *Signifies difference from Sham group. # Signifies difference from Cas+ND group.
Figure 5
Figure 5
Castration does not change muscle AMPK signaling while PGC-1α mRNA expression and oxidative protein expression altered. A) Upper: representative western blot of phosphorylated AMPK (Thr172) and total AMPK in the gastrocnemius. Lower: The ratio of phosphorylated to total forms of AMPK in the gastrocnemius muscle. B) Upper: representative western blot of phosphorylated raptor (Ser792) and total raptor in the gastrocnemius. Lower: The ratio of phosphorylated to total forms of raptor in the gastrocnemius muscle. C) PGC-1α mRNA expression. D) Upper: representative western blot of CoxIV and VDAC proteins in the gastrocnemius. Lower: Quantification of CoxIV and VDAC protein expression in the gastrocnemius muscle. E) MHC IIa and IIb mRNA expression. Values are means ± SE. Significance was set at p<0.05.
Figure 5
Figure 5
Castration does not change muscle AMPK signaling while PGC-1α mRNA expression and oxidative protein expression altered. A) Upper: representative western blot of phosphorylated AMPK (Thr172) and total AMPK in the gastrocnemius. Lower: The ratio of phosphorylated to total forms of AMPK in the gastrocnemius muscle. B) Upper: representative western blot of phosphorylated raptor (Ser792) and total raptor in the gastrocnemius. Lower: The ratio of phosphorylated to total forms of raptor in the gastrocnemius muscle. C) PGC-1α mRNA expression. D) Upper: representative western blot of CoxIV and VDAC proteins in the gastrocnemius. Lower: Quantification of CoxIV and VDAC protein expression in the gastrocnemius muscle. E) MHC IIa and IIb mRNA expression. Values are means ± SE. Significance was set at p<0.05.
Figure 6
Figure 6
Phosphorylation status of Akt targets PRAS40, GSK3β and FoxO3a are altered with castration. A) Upper: representative western blot of phosphorylated PRAS40 (Thr246) and total PRAS40 in the gastrocnemius. Lower: The ratio of phosphorylated to total forms of PRAS40 in the gastrocnemius muscle. B) Upper: representative western blot of phosphorylated GSK3β (Ser9) and total GSK3β in the gastrocnemius. Lower: The ratio of phosphorylated to total forms of GSK3β in the gastrocnemius muscle. C) Upper: representative western blot of phosphorylated FoxO3a (Ser253) and total FoxO3a. Lower: The ratio of phosphorylated to total forms of FoxO3a. Values are means ± SE. Significance was set at p<0.05. *Signifies difference from Sham group. # Signifies difference from Cas+ND group.
Figure 6
Figure 6
Phosphorylation status of Akt targets PRAS40, GSK3β and FoxO3a are altered with castration. A) Upper: representative western blot of phosphorylated PRAS40 (Thr246) and total PRAS40 in the gastrocnemius. Lower: The ratio of phosphorylated to total forms of PRAS40 in the gastrocnemius muscle. B) Upper: representative western blot of phosphorylated GSK3β (Ser9) and total GSK3β in the gastrocnemius. Lower: The ratio of phosphorylated to total forms of GSK3β in the gastrocnemius muscle. C) Upper: representative western blot of phosphorylated FoxO3a (Ser253) and total FoxO3a. Lower: The ratio of phosphorylated to total forms of FoxO3a. Values are means ± SE. Significance was set at p<0.05. *Signifies difference from Sham group. # Signifies difference from Cas+ND group.
Figure 7
Figure 7
FoxO transcriptional targets atrogin-1, MuRF1 and REDD1 are increased with castration. A) MuRF1mRNA expression. B) Atrogin-1 mRNA expression C) REDD1 mRNA expression. Data are normalized to the Sham. Values are means ± SE. Significance was set at p<0.05. *Signifies difference from Sham group. # Signifies difference from Cas+ND group.
Figure 8
Figure 8
Testosterone administration increases mTORC1 signaling in C2C12 myoblasts. C2C12 myoblasts were treated with 5, 50 and 500nM testosterone for 24 hours. A) Representative western blot of phosphorylated and total forms of Akt (Ser 473), mTOR (Ser2448), GSK3β (Ser9), S6 ribosomal protein (Ser235/236), PRAS40 (t246) and FoxO3a (Ser253) with varying doses of testosterone. Protein expression of phosphorylated forms of B) Akt, C) mTOR, D) GSK3β, E) S6, F) PRAS40 and G) FoxO3a . H) Representative western blot of phosphorylated and total forms of Akt (Ser 473), mTOR (Ser2448) and p70S6K (t389) during 50 nM testosterone treatment followed by 24 hours of testosterone withdrawal. Protein expression of phosphorylated forms of I) Akt, J) mTOR and K) p70S6K normalized to the Etoh vehicle control. Values are means ± SE. Significance was set at p<0.05. *Signifies difference from Etoh vehicle/0hr group. † Significant from cells treated with 50nM testosterone/24hr T group.
Figure 8
Figure 8
Testosterone administration increases mTORC1 signaling in C2C12 myoblasts. C2C12 myoblasts were treated with 5, 50 and 500nM testosterone for 24 hours. A) Representative western blot of phosphorylated and total forms of Akt (Ser 473), mTOR (Ser2448), GSK3β (Ser9), S6 ribosomal protein (Ser235/236), PRAS40 (t246) and FoxO3a (Ser253) with varying doses of testosterone. Protein expression of phosphorylated forms of B) Akt, C) mTOR, D) GSK3β, E) S6, F) PRAS40 and G) FoxO3a . H) Representative western blot of phosphorylated and total forms of Akt (Ser 473), mTOR (Ser2448) and p70S6K (t389) during 50 nM testosterone treatment followed by 24 hours of testosterone withdrawal. Protein expression of phosphorylated forms of I) Akt, J) mTOR and K) p70S6K normalized to the Etoh vehicle control. Values are means ± SE. Significance was set at p<0.05. *Signifies difference from Etoh vehicle/0hr group. † Significant from cells treated with 50nM testosterone/24hr T group.

References

    1. Katznelson L, Finkelstein JS, Schoenfeld DA, Rosenthal DI, Anderson EJ, Klibanski A. Increase in bone density and lean body mass during testosterone administration in men with acquired hypogonadism. J Clin Endocrinol Metab. 1996;81:4358–4365. - PubMed
    1. Bhasin S, Storer TW, Berman N, Yarasheski KE, Clevenger B, Phillips J, Lee WP, Bunnell TJ, Casaburi R. Testosterone replacement increases fat-free mass and muscle size in hypogonadal men. J Clin Endocrinol Metab. 1997;82:407–413. - PubMed
    1. Brodsky IG, Balagopal P, Nair KS. Effects of testosterone replacement on muscle mass and muscle protein synthesis in hypogonadal men--a clinical research center study. J Clin Endocrinol Metab. 1996;81:3469–3475. - PubMed
    1. Dobs AS, Dempsey MA, Ladenson PW, Polk BF. Endocrine disorders in men infected with human immunodeficiency virus. Am J Med. 1988;84:611–616. - PubMed
    1. Johansen KL. Testosterone metabolism and replacement therapy in patients with end-stage renal disease. Semin Dial. 2004;17:202–208. - PubMed

Publication types

MeSH terms