. 2012 Nov;17(11):116010.
doi: 10.1117/1.JBO.17.11.116010.

Epithelium and Bowman's layer thickness and light scatter in keratoconic cornea evaluated using ultrahigh resolution optical coherence tomography

Affiliations

Epithelium and Bowman's layer thickness and light scatter in keratoconic cornea evaluated using ultrahigh resolution optical coherence tomography

Rahul Yadav et al. J Biomed Opt. 2012 Nov.

Abstract

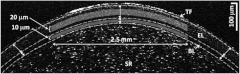
A custom-developed ultrahigh resolution optical coherence tomography with an axial resolution of 1.1 μm in corneal tissue was used to characterize thickness and light scatter of the epithelium and Bowman's layer in keratoconic (KC) cornea noninvasively. A 4-mm wide vertical corneal section around the apex in nine KC and eight normal eyes was imaged in vivo. The epithelium and Bowman's layer were visualized and their thickness profiles were quantified. Scatter was quantified based on the sensitivity normalized mean signal intensity distribution. Average mean thickness of the epithelium and Bowman's layer in KC eyes was significantly smaller (p<0.05) than the normal eyes. The epithelium thickness variation across a central 3-mm cornea was significantly larger in KC eyes than in normal eyes. The scatter in KC eyes was significantly increased only for Bowman's layer. The changes observed in this study could improve our understanding of the underlying disease mechanism of KC and can provide new indications for early disease diagnosis.


Figures

Fig. 1
Fig. 1
OCT image analysis. Corneal image obtained by the OCT system showing the ocular surface. TF: Tear film, EL: Epithelium, BL: Bowman’s layer, SR: Stroma. The white dashed curves indicate the identified interfaces of the epithelium and Bowman’s layer. Thickness profiles were obtained by measuring radial distances as shown by the arrows. Sensitivity normalized signal intensity averaged over a region 2.5 mm wide and of thickness of 20 μm and 10 μm, respectively, shown in shaded gray, in epithelium and Bowman’s layer was used to measure light scatter. See Fig. 2(a) for an unannotated version of the same image.
Fig. 2
Fig. 2
Images obtained by the system for a normal (a), three KC patients (b), (c) and (d) with increasing corneal coma, where corneal coma represents the KC disease severity. A reduction in the epithelium and Bowman’s layer thickness can be seen for KC eyes. In most severe KC patient (d) the interfaces of Bowman’s layer with epithelium and stroma are difficult to distinguish. Hyper-reflective centers, visible as white patches, can be seen in the Bowman’s layer of the moderate KC (c).
Fig. 3
Fig. 3
Scatter plot showing mean epithelium (a) and Bowman’s layer (b) thickness plotted against corneal coma (4 mm pupil size). The epithelium and Bowman’s layer thickness in KC eyes was significantly smaller than normal eyes (p=0.023 for epithelium and p=0.006 for Bowman’s layer). A negative correlation was observed between epithelium thickness and disease severity (R2=0.50) while no correlation was found for Bowman’s layer thickness (R2=0.15).
Fig. 4
Fig. 4
Scatter plot showing epithelium (a) and Bowman’s layer (b) thickness variability plotted against corneal coma (4 mm pupil size). The thickness variability was significantly higher in epithelium (p=0.004) but not in Bowman’s layer (p=0.090). A positive correlation can be observed between disease severity and epithelium thickness variability (R2=0.61), while no correlation was observed for Bowman’s layer (R2=0.08).
Fig. 5
Fig. 5
The plot showing average local epithelial thickness (a) and Bowman’s layer thickness (b), averaged over the subjects, as a function of the lateral distance from the apex for normals and two KC groups. KC group 1 has eyes with corneal coma (4 mm pupil) <1  μm while KC group 2 eyes have corneal coma >1  μm. A pattern of inferior epithelial thinning was found in both the KC groups with the inferior thinning being significantly larger in KC group 2. The epithelial thickness in the inferior cornea was significantly smaller than the superior cornea only for KC group 2 (p=0.001). No specific pattern was observed in the Bowman’s layer thickness profile for all the groups.
Fig. 6
Fig. 6
Bar graph comparing scatter in epithelium (a) and Bowman’s layer (b) for normal and KC eyes. The increase in scatter was statistically significant (p=0.036) only for the Bowman’s layer.

References

    1. Krachmer J. H., Feder R. S., Belin M. W., “Keratoconus and related non-inflammatory corneal disorders,” Surv. Ophthalmol. 28(4), 293–322 (1984).SUOPAD10.1016/0039-6257(84)90094-8 - DOI - PubMed
    1. Rabinowitz Y. S., “Keratoconus,” Surv. Ophthalmol. 42(4), 297–319 (1998).SUOPAD10.1016/S0039-6257(97)00119-7 - DOI - PubMed
    1. Hofstetter H., “A keratoscopic survey of 13,395 eyes,” Am. J. Optom. Acad. Optom. 36(1), 3–11 (1959).AJOAAX - PubMed
    1. Scroggs M. W., Proia A. D., “Histopathological variation in keratoconus,” Cornea 11(6), 553–559 (1992).CORNDB10.1097/00003226-199211000-00012 - DOI - PubMed
    1. Tsubota K., et al. , “Corneal epithelium in keratoconus,” Cornea 14(1), 77–83 (1995).CORNDB10.1097/00003226-199501000-00013 - DOI - PubMed

Publication types

MeSH terms