. 2013 Feb 1;22(3):544-57.
doi: 10.1093/hmg/dds465. Epub 2012 Oct 30.

The molecular function and clinical phenotype of partial deletions of the IGF2/H19 imprinting control region depends on the spatial arrangement of the remaining CTCF-binding sites

Affiliations

The molecular function and clinical phenotype of partial deletions of the IGF2/H19 imprinting control region depends on the spatial arrangement of the remaining CTCF-binding sites

Jasmin Beygo et al. Hum Mol Genet. .

Abstract

At chromosome 11p15.5, the imprinting centre 1 (IC1) controls the parent of origin-specific expression of the IGF2 and H19 genes. The 5 kb IC1 region contains multiple target sites (CTS) for the zinc-finger protein CTCF, whose binding on the maternal chromosome prevents the activation of IGF2 and allows that of H19 by common enhancers. CTCF binding helps maintaining the maternal IC1 methylation-free, whereas on the paternal chromosome gamete-inherited DNA methylation inhibits CTCF interaction and enhancer-blocking activity resulting in IGF2 activation and H19 silencing. Maternally inherited 1.4-2.2 kb deletions are associated with methylation of the residual CTSs and Beckwith-Wiedemann syndrome, although with different penetrance and expressivity. We explored the relationship between IC1 microdeletions and phenotype by analysing a number of previously described and novel mutant alleles. We used a highly quantitative assay based on next generation sequencing to measure DNA methylation in affected families and analysed enhancer-blocking activity and CTCF binding in cultured cells. We demonstrate that the microdeletions mostly affect IC1 function and CTCF binding by changing CTS spacing. Thus, the extent of IC1 inactivation and the clinical phenotype are influenced by the arrangement of the residual CTSs. A CTS spacing similar to the wild-type allele results in moderate IC1 inactivation and is associated with stochastic DNA methylation of the maternal IC1 and incomplete penetrance. Microdeletions with different CTS spacing display severe IC1 inactivation and are associated with IC1 hypermethylation and complete penetrance. Careful characterization of the IC1 microdeletions is therefore needed to predict recurrence risks and phenotypical outcomes.


Figures

Figure 1.
Figure 1.
IC1 microdeletions investigated in this study. Blank spaces correspond to deleted sequences. The positions of the CTS1–7 and the organization in A-type and B-type repeats are shown for each IC1 allele. The relative positions of the IGF2 and H19 genes and the common enhancers are indicated only for the wild-type allele. The CTSs whose methylation is analysed by NGS are highlighted.
Figure 2.
Figure 2.
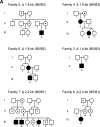
DNA methylation analysis. (A). Pedigrees of the families investigated. The individuals studied are underlined. Unaffected deletion carriers are indicated by a dot. (B and C). Heatmaps for the methylation patterns obtained by next generation bisulfite sequencing for CTS1 and 6, respectively. The methylation pattern of a normal control (NC) is shown on the left side. The methylation analyses were performed with or without allele separation for each deletion carrier investigated. The results were arranged according to their parental origin. In the heatmaps of individuals, III.2 of family 7 and III.1, II.2 and II.3 of family 8 a blue column inside methylated sequences represent a SNP (rs10732516 C>T) which changes a CpG to a TpG and therefore is scored as unmethylated by the BiQ Analyzer software. Lines represent sequence reads, columns CpGs. Blue—unmethylated; red—methylated; white—missing sequence information; mat, maternal allele; pat, paternal allele; del, allele harbouring the IC1 deletion; WT, wild-type allele; NC, normal control; CTS, CTCF target site.
Figure 2.
Figure 2.
DNA methylation analysis. (A). Pedigrees of the families investigated. The individuals studied are underlined. Unaffected deletion carriers are indicated by a dot. (B and C). Heatmaps for the methylation patterns obtained by next generation bisulfite sequencing for CTS1 and 6, respectively. The methylation pattern of a normal control (NC) is shown on the left side. The methylation analyses were performed with or without allele separation for each deletion carrier investigated. The results were arranged according to their parental origin. In the heatmaps of individuals, III.2 of family 7 and III.1, II.2 and II.3 of family 8 a blue column inside methylated sequences represent a SNP (rs10732516 C>T) which changes a CpG to a TpG and therefore is scored as unmethylated by the BiQ Analyzer software. Lines represent sequence reads, columns CpGs. Blue—unmethylated; red—methylated; white—missing sequence information; mat, maternal allele; pat, paternal allele; del, allele harbouring the IC1 deletion; WT, wild-type allele; NC, normal control; CTS, CTCF target site.
Figure 3.
Figure 3.
Enhancer-blocking assay. Hep3B cells were transfected with the constructs described in Figure 1. Pools of NeoR-resistant clones were collected and their luciferase activity assayed. The activity expressed by the control construct containing the λ spacer was set as 100%. Data represent the average of three independent experiments and are expressed as the means ± SD. P-values calculated with Student's t-test are indicated, when statistically significant. Note that the Δ1.4 kb (B5/B3), Δ 1.8 kb (B6/B3), Δ 1.8 kb (B5/B2) and Δ A2 alleles display lower enhancer-blocking activity than the Δ 0.8 kb (B3/B1), Δ 2.2 kb (B5/B1), OCT-mut and WT alleles. EpL, plasmid without insert; pL, plasmid without enhancer and insert.
Figure 4.
Figure 4.
In vitro-generated IC1 mutations. Schematic diagram shows the in vitro-generated A2 deletion and OCT-mut alleles. The position of the OCT-binding motifs is indicated by small circles and the mutated OCT-binding motifs are slashed.
Figure 5.
Figure 5.
Chromatin ImmunoPrecipitation assay. Chromatin extracted from Hep3B cells transfected with the constructs described in Supplementary Material, Fig. S2 was immunoprecipitated with anti-CTCF antibodies. The amount of exogenous IC1 DNA present in the immunoprecipitated material was estimated by real-time PCR and expressed as percent of input. IC1 values were normalized against the values obtained for an endogenous high-affinity CTCF-binding region. Data represent the average of three independent experiments and are expressed as the means ± SD. P-values calculated with Student's t-test are indicated, when statistically significant. The results shown have been obtained by using primers specific for the CTS1 region. Similar results have been obtained by using primers for a region close to CTS6 (Supplementary Material, Fig. S4). Primers for an endogenous region with no known CTCF binding were used to measure non-specific binding (grey bars). Note that the efficiency of CTCF binding to the Δ 1.4 kb (B5/B3), Δ 1.8 kb (B6/B3), Δ 1.8 kb (B5/B2) and Δ A2 IC1 alleles is lower than that to the Δ 0.8 kb (B3/B1), Δ 2.2 kb (B5/B1), OCT-mut and WT alleles.

References

    1. Choufani S., Shuman C., Weksberg R. Beckwith-Wiedemann syndrome. Am. J. Med. Genet. C. Semin. Med. Genet. 2010;154C:343–354. - PubMed
    1. Cerrato F., Sparago A., Di Matteo I., Zou X., Dean W., Sasaki H., Smith P., Genesio R., Bruggemann M., Reik W., Riccio A. The two-domain hypothesis in Beckwith–Wiedemann syndrome: autonomous imprinting of the telomeric domain of the distal chromosome 7 cluster. Hum. Mol. Genet. 2005a;14:503–511. - PubMed
    1. Bartolomei M.S. Genomic imprinting: employing and avoiding epigenetic processes. Genes Dev. 2009;23:2124–2133. - PMC - PubMed
    1. Ferguson-Smith A.C. Genomic imprinting: the emergence of an epigenetic paradigm. Nat. Rev. Genet. 2011;12:565–575. - PubMed
    1. Bartolomei M.S., Ferguson-Smith A.C. Mammalian genomic imprinting. Cold Spring Harb. Perspect. Biol. 2011;3 doi:10.1101/cshperspect.a002592. - DOI - PMC - PubMed

Publication types

MeSH terms