. 2012;7(10):e46935.
doi: 10.1371/journal.pone.0046935. Epub 2012 Oct 31.

Non-gaussian distributions affect identification of expression patterns, functional annotation, and prospective classification in human cancer genomes

Affiliations

Non-gaussian distributions affect identification of expression patterns, functional annotation, and prospective classification in human cancer genomes

Nicholas F Marko et al. PLoS One. 2012.

Abstract

Introduction: Gene expression data is often assumed to be normally-distributed, but this assumption has not been tested rigorously. We investigate the distribution of expression data in human cancer genomes and study the implications of deviations from the normal distribution for translational molecular oncology research.

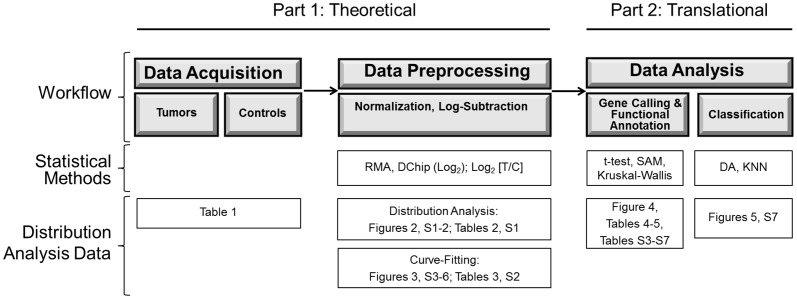
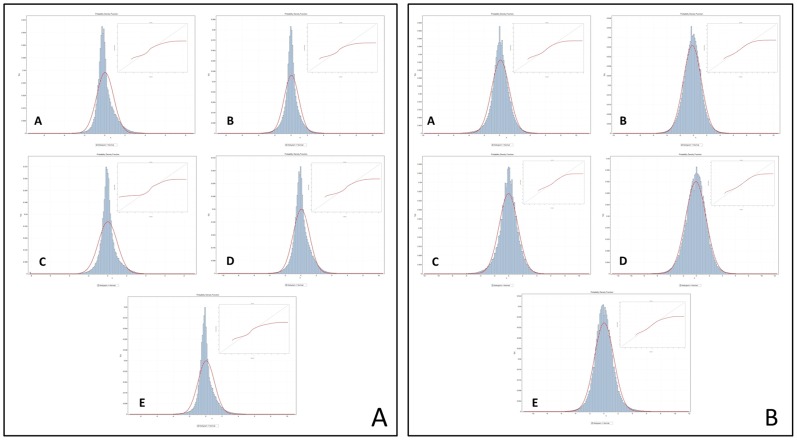
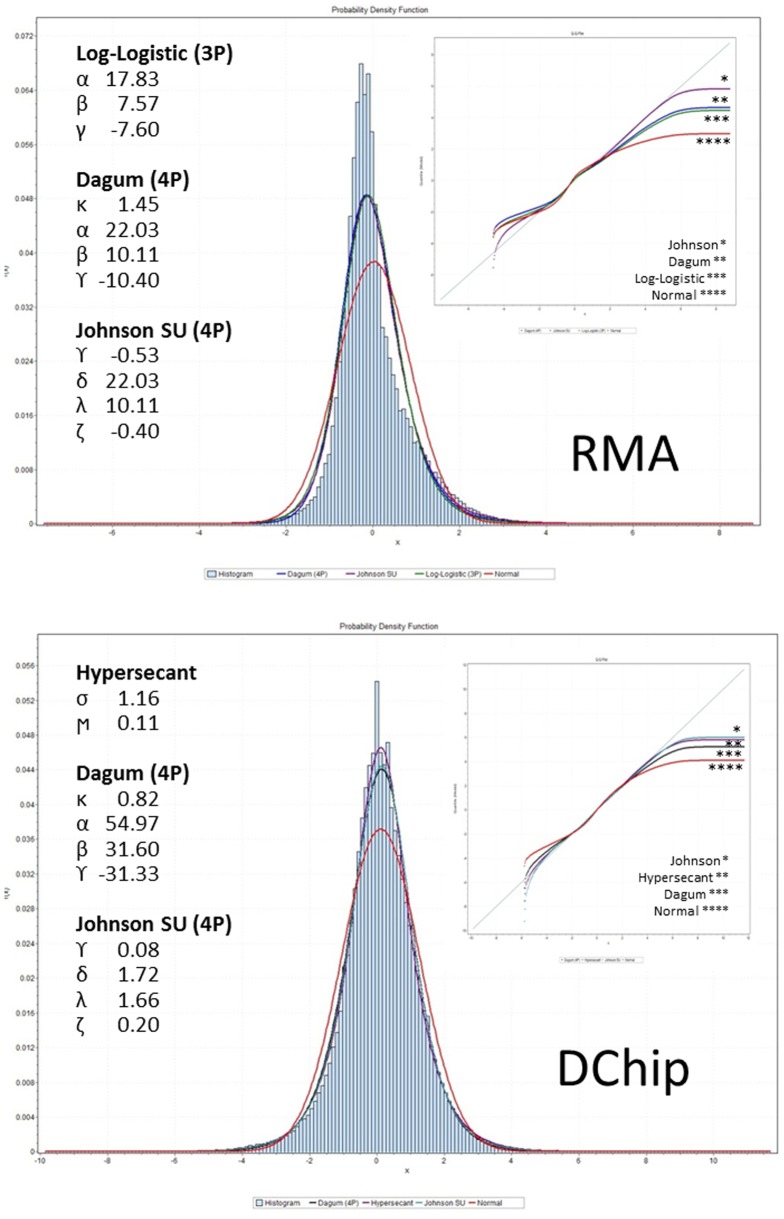
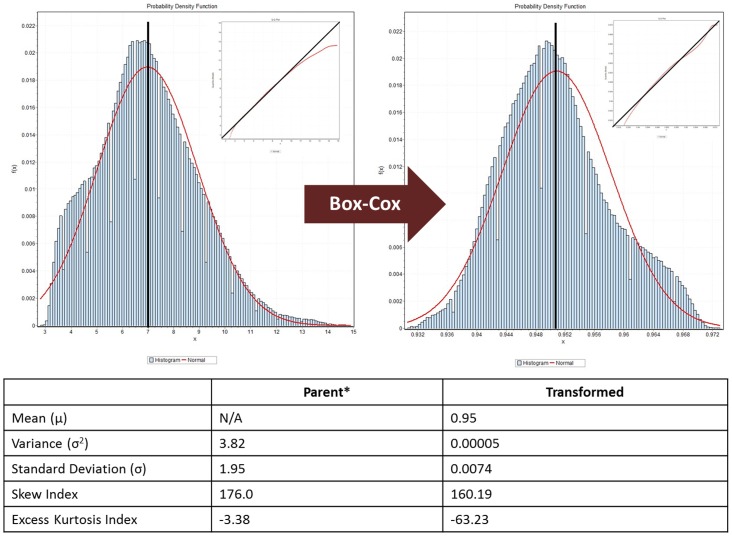
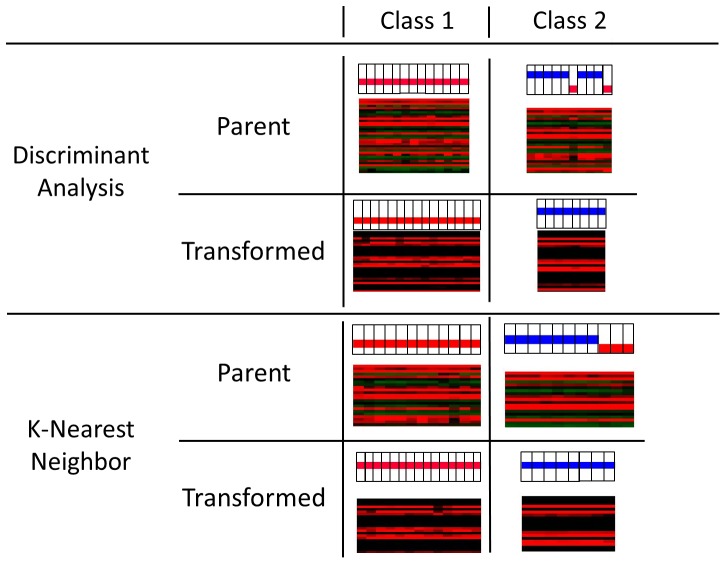
Methods: We conducted a central moments analysis of five cancer genomes and performed empiric distribution fitting to examine the true distribution of expression data both on the complete-experiment and on the individual-gene levels. We used a variety of parametric and nonparametric methods to test the effects of deviations from normality on gene calling, functional annotation, and prospective molecular classification using a sixth cancer genome.

Results: Central moments analyses reveal statistically-significant deviations from normality in all of the analyzed cancer genomes. We observe as much as 37% variability in gene calling, 39% variability in functional annotation, and 30% variability in prospective, molecular tumor subclassification associated with this effect.

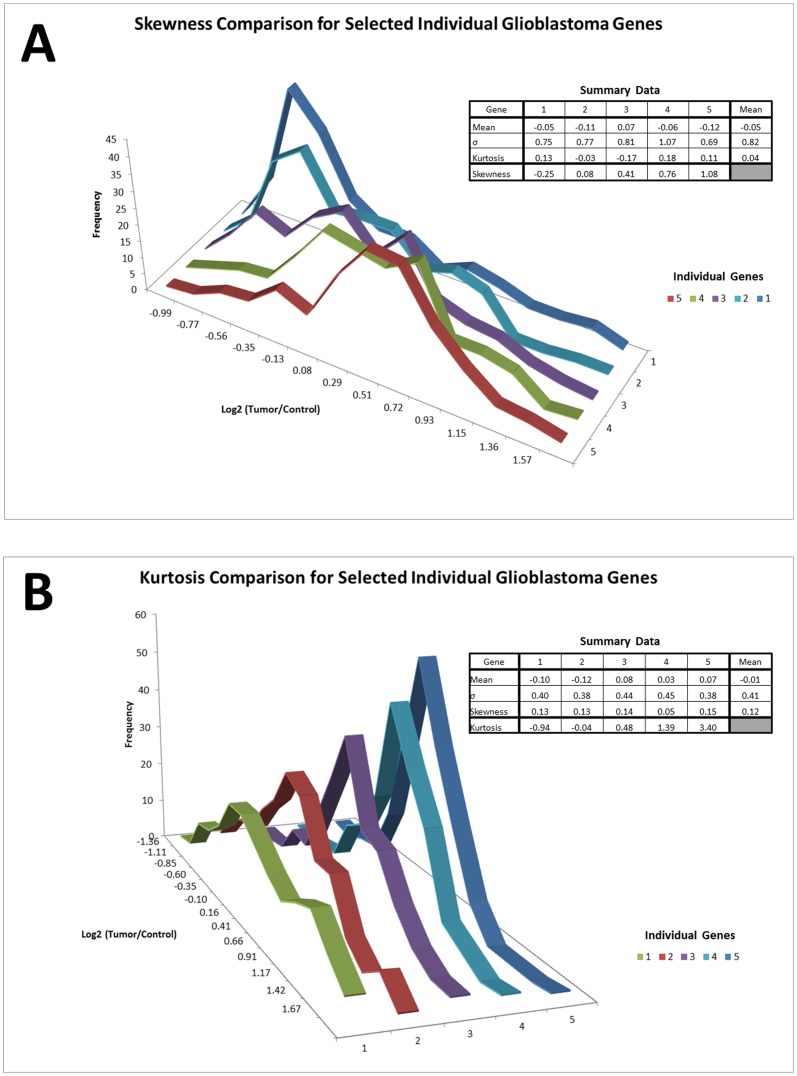
Conclusions: Cancer gene expression profiles are not normally-distributed, either on the complete-experiment or on the individual-gene level. Instead, they exhibit complex, heavy-tailed distributions characterized by statistically-significant skewness and kurtosis. The non-Gaussian distribution of this data affects identification of differentially-expressed genes, functional annotation, and prospective molecular classification. These effects may be reduced in some circumstances, although not completely eliminated, by using nonparametric analytics. This analysis highlights two unreliable assumptions of translational cancer gene expression analysis: that "small" departures from normality in the expression data distributions are analytically-insignificant and that "robust" gene-calling algorithms can fully compensate for these effects.


Conflict of interest statement

Competing Interests: The authors have declared that no competing interests exist.

Figures

Figure 1
Figure 1. Overview of Analytic Workflow.
The flow diagram depicts typical microarray analysis workflow (top section), the statistical methods used at each step (middle section), and the corresponding tables and figures in this manuscript that present analyses at each level (bottom section).
Figure 2
Figure 2. Cancer gene expression datasets are not normally-distributed.
The source data for these graphs are the Log2-subtracted datasets. All bin widths have been set to 200 to improve visualization. Red curves represent the best-fit normal distribution. The primary image gives the histogram with the superimposed theoretical normal curve. The inset presents the quantile-quantile (QQ) plot, where deviation from the line (y = x, black) illustrates deviation of the empiric from the theoretical normal distribution. Left panel shows data normalized with the RMA method. Right panel shows data normalized with the DChip method. A: Brain; B: Breast; C: Colon; D: Gastric; E: Ovarian.
Figure 3
Figure 3. Single-Gene Expression Distributions are not Gaussian.
These graphs illustrate the wide range of potential skewness (A) and kurtosis (B) that exist in the expression distributions of individual genes comprising the cancer expression datasets. This refutes the assumption that the expression data for individual genes follow an approximately Gaussian distribution around the gene's mean expression level. Data for these graphs was taken from the log2-subtracted, RMA-normalized glioblastoma expression data. For the skewness comparison, five genes with comparable means, standard deviations, and kurtosis were selected from subsets of genes representing approximately the 10th, 25th, 50th, 75th and 90th percentiles for per-gene skewness contained in the dataset. Similarly, for the kurtosis comparison, five genes with comparable means, standard deviations, and skewness were selected from subsets of genes representing approximately the 10th, 25th, 50th, 75th and 90th percentiles for per-gene kurtosis contained in the dataset. The identities of the genes are not germane for comparative purposes.
Figure 4
Figure 4. Distribution Fitting.
Distribution fitting for the brain cancer dataset for RMA (top) and DChip (bottom) normalized data. The three best-fit curves are superimposed on the histogram, and the normal distribution curve is included for comparison. The specific parameters for the best-fit distributions are given. The inset displays the quantile-quantile (QQ) plot for the best-fit and normal distributions. These charts demonstrate that multiparameter distributions capable of modeling skewness and kurtosis better characterize the data than the standard Gaussian (normal) distribution. Similar graphs for additional tumor types are given in figures S2, S3, S4, S5.
Figure 5
Figure 5. Distribution Transformation.
A Box-Cox transformation applied to the low-grade glioma dataset (left) results in a distribution that more closely approximates a normal distribution (right). Note that the parent distribution was recentered to a zero mean to compensate for the default mean of the Robust Multichip Normalization output of 7. This transformed distribution was then used to analyze distribution-dependent effects on identification of differentially-expressed genes, functional annotation, and prospective molecular classification.
Figure 6
Figure 6. Distribution-Dependent Effects on Molecular Tumor Subclassification.
Two methods of prospective molecular classification, the parametric Discriminant Analysis (DA, top) and the nonparametric K-Nearest Neighbors classifier (KNN, bottom), were used in conjunction with the parent and transformed low-grade glioma expression datasets to study distribution-dependent effects molecular tumor subclassification. Class 1 represents low-grade, 1p/19q-intact gliomas, and Class 2 represents chromosome 1p/19q codeleted, low-grade oligodendrogliomas. The topmost color bars represent the known class of each sample (black boxes; red = Class 1, blue = Class 2). The area below the color bars is a portion of the gene expression profile (red = underexpressed, green = overexpressed). DA used in conjunction with the parent (non-normal) distribution produces two misclassifications and KNN produces 3, while both methods used with the transformed dataset result in accurate molecular subclassification.

References

    1. Seo J, Gordish-Dressman H, Hoffman EP (2006) An interactive power analysis tool for microarray hypothesis testing and generation. Bioinformatics 22: 808–814. - PubMed
    1. Bogner V, Leidel BA, Kanz KG, Mutschler W, Neugebauer EA, et al. (2011) Pathway analysis in microarray data: a comparison of two different pathway analysis devices in the same data set. Shock 35: 245–251. - PubMed
    1. Katara P, Sharma N, Sharma S, Khatri I, Kaushik A, et al. (2010) Comparative microarray data analysis for the expression of genes in the pathway of glioma. Bioinformation 5: 31–34. - PMC - PubMed
    1. Hardiman G (2008) Applications of microarrays and biochips in pharmacogenomics. Methods Mol Biol 448: 21–30. - PubMed
    1. Marko NF, Prayson RA, Barnett GH, Weil RJ (2010) Integrated molecular analysis suggests a three-class model for low-grade gliomas: a proof-of-concept study. Genomics 95: 16–24. - PubMed

Publication types