. 2012;7(10):e47484.
doi: 10.1371/journal.pone.0047484. Epub 2012 Oct 30.

Muscarinic and nicotinic modulation of thalamo-prefrontal cortex synaptic plasticity [corrected] in vivo

Affiliations

Muscarinic and nicotinic modulation of thalamo-prefrontal cortex synaptic plasticity [corrected] in vivo

Lezio Soares Bueno-Junior et al. PLoS One. 2012.

Erratum in

  • PLoS One. 2012; 7(11). doi:10.1371/annotation/d2dbf233-db12-431f-b9b6-4bd31cbca23e

Abstract

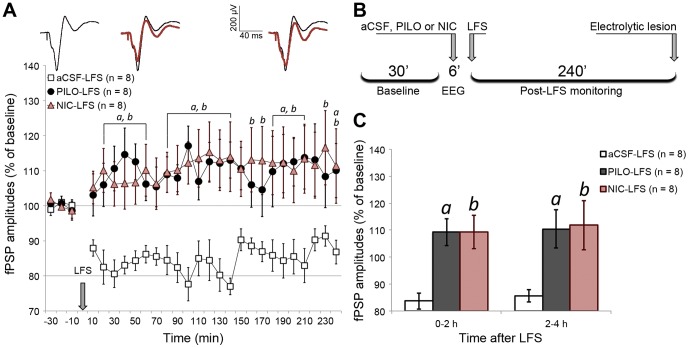
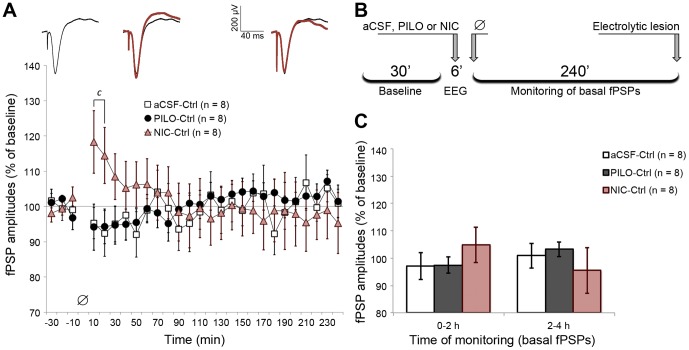
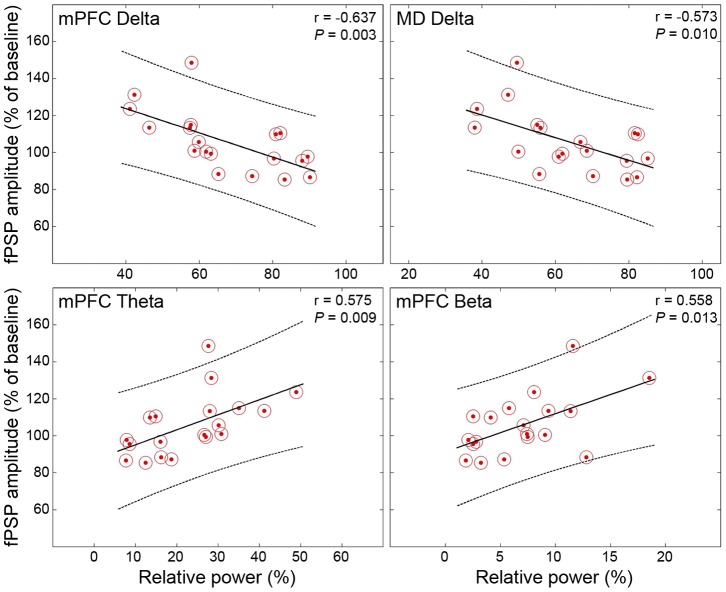
The mediodorsal nucleus of the thalamus (MD) is a rich source of afferents to the medial prefrontal cortex (mPFC). Dysfunctions in the thalamo-prefrontal connections can impair networks implicated in working memory, some of which are affected in Alzheimer disease and schizophrenia. Considering the importance of the cholinergic system to cortical functioning, our study aimed to investigate the effects of global cholinergic activation of the brain on MD-mPFC synaptic plasticity by measuring the dynamics of long-term potentiation (LTP) and depression (LTD) in vivo. Therefore, rats received intraventricular injections either of the muscarinic agonist pilocarpine (PILO; 40 nmol/µL), the nicotinic agonist nicotine (NIC; 320 nmol/µL), or vehicle. The injections were administered prior to either thalamic high-frequency (HFS) or low-frequency stimulation (LFS). Test pulses were applied to MD for 30 min during baseline and 240 min after HFS or LFS, while field postsynaptic potentials were recorded in the mPFC. The transient oscillatory effects of PILO and NIC were monitored through recording of thalamic and cortical local field potentials. Our results show that HFS did not affect mPFC responses in vehicle-injected rats, but induced a delayed-onset LTP with distinct effects when applied following PILO or NIC. Conversely, LFS induced a stable LTD in control subjects, but was unable to induce LTD when applied after PILO or NIC. Taken together, our findings show distinct modulatory effects of each cholinergic brain activation on MD-mPFC plasticity following HFS and LFS. The LTP-inducing action and long-lasting suppression of cortical LTD induced by PILO and NIC might implicate differential modulation of thalamo-prefrontal functions under low and high input drive.


Conflict of interest statement

Competing Interests: The authors have declared that no competing interests exist.

Figures

Figure 1
Figure 1. Histological validation of implants and typical prefrontal fPSPs.
(A) Positioning of electrodes and cannulae from a coronal point of view. For mPFC and MD, coronal plates represent the anteroposterior variation of the electrode tip positioning (red dots), preferentially at the PrL of mPFC (layer-inespecific) and the anterior half of MD (subdivision-inespecific), both in the left hemisphere. For LV, the coronal plates show the variation of the cannula positioning (red bars) just above the right lateral ventricle, where the experimental drugs were injected. In the representative Nissl-stained coronal sections, the arrows point to typical electrolytic lesions (applied after the end of the experiments) and cannula tract. (B) Once the recording electrode was positioned at the mPFC, a typical dorsoventral profile of fPSPs was consistently evoked across subjects, while the stimulation electrode was lowered towards the MD (see details in the text). (C) Diversity of MD-evoked fPSPs recorded in the mPFC. The first fPSP shows a clear differentiation between two distinct negative peaks, which we termed N1 (amplitude 108.20±9.32 µV; latency 6.85±0.15 ms) and N2 (amplitude 270.00±17.10 µV; latency 13.43±0.17 ms). Such an aspect of fPSP was obtained in approximately half the subjects. In some cases, like the second fPSP, the N1 peak was subtle. Finally, in some other cases, like the third fPSP, the N1 peak was indistinguishable.
Figure 2
Figure 2. Concentration-dependent effect of NIC on forebrain oscillatory activity.
Different concentrations of NIC (160, 320, and 640 nmol/µL; 1 µL icv) were injected while LFPs were continuously recorded during 120 min for analysis of the power spectrum at delta (0.5–4 Hz), theta (4–12 Hz), beta (12–30 Hz), and gamma (30–80 Hz) frequency bands. (A) Continuous thalamic and cortical LFP recording from a representative subject. (B) Analysis of latency and duration of LFP changes induced by the injection of the different NIC concentrations in a sample of eight rats. The sequence of injections at the different concentrations was randomized (data shown as the mean ± SEM). (C) Representative EEG tracings from mPFC and MD before and after NIC injection. Based on these experiments, we decided to use NIC 320 nmol/µL to induce a transient effect matching the duration of HFS and LFS protocols.
Figure 3
Figure 3. LFP power spectrum comparing mPFC and MD oscillatory activity before, during, and after microinjection.
(A) Charts detailing PILO and NIC effects on LFPs, showing a decrease in delta (0.5–4 Hz), as well as an increase in theta (4–12 Hz), beta (12–30 Hz), and gamma (30–80 Hz) relative power. The LFP changes induced by NIC occurred earlier than those induced by PILO, with a shorter duration of theta potentiation, and a stronger potentiation of beta and gamma waves. The data were obtained from all aCSF, PILO and NIC rats of the synaptic plasticity experiments. Significant differences are indicated by two-way repeated measures ANOVA followed by the Newman-Keuls post-hoc test (black bar: aCSF vs. PILO; red bar: aCSF vs. NIC). (B) Representative EEG tracings from mPFC and MD before and after icv microinjections. Data are shown as the mean ± SEM.
Figure 4
Figure 4. HFS induced a late LTP in mPFC only when applied under PILO and NIC effects.
(A) fPSP amplitude throughout baseline (30 min) and post-HFS monitoring (240 min), depicting amplitudes averaged in 10-min blocks and normalized in relation to baseline mean amplitude. Significant differences are indicated by two-way ANOVA with repeated measures, followed by the Newman-Keuls post-hoc test (a = PILO vs. aCSF; b = NIC vs. aCSF; p<0.05). The sequence of averaged fPSPs above the chart represents a typical PILO-HFS experiment, where post-HFS fPSPs (red) are superimposed on baseline fPSPs (black). Such fPSPs are roughly aligned with the time course of the chart. (B) Timeline summarizing the procedures for HFS experiments. (C) Data from chart A clustered in blocks of 2 h after HFS, highlighting PILO and NIC significant effects restricted to the second half of the monitoring. Data are shown as the mean ± SEM.
Figure 5
Figure 5. LFS induced a stable LTD in mPFC only when applied under urethane-driven slow-wave context.
(A) fPSP amplitude throughout baseline (30 min) and post-LFS monitoring (240 min), depicting amplitudes averaged in 10 min blocks and normalized in relation to baseline mean amplitude. Significant differences are indicated by two-way ANOVA with repeated measures, followed by the Newman-Keuls post-hoc test (a = PILO vs. aCSF; b = NIC vs. aCSF; p<0.05). The sequence of averaged fPSPs above the chart represents a typical aCSF-LFS experiment, where post-LFS fPSPs (red) are superimposed on baseline fPSPs (black). Such fPSPs are roughly aligned with the time course of the chart. (B) Timeline summarizing the procedures for LFS experiments. (C) Data from chart A clustered in blocks of 2 h after LFS, showing the stability of PILO and NIC effects throughout the monitoring. Data are shown as mean ± SEM.
Figure 6
Figure 6. PILO and NIC microinjection alone did not induce long-term changes in MD-evoked prefrontal fPSPs.
(A) fPSP amplitude throughout baseline (30 min) and monitoring (240 min), depicting amplitudes averaged in 10 min blocks and normalized in relation to baseline mean amplitude. Significant differences are indicated by two-way ANOVA with repeated measures, followed by the Newman-Keuls post-hoc test (c = NIC vs. both aCSF and PILO; p<0.05). The sequence of averaged fPSPs above the chart represents a typical NIC-Ctrl experiment, where fPSPs recorded during the 4 h monitoring (red) are superimposed on baseline fPSPs (black). Such fPSPs are roughly aligned with the time course of the chart. (B) Timeline summarizing the procedures for Ctrl experiments, in which the empty-set symbol represents absence of train stimulation. (C) Data from chart A clustered in blocks of 2 h of monitoring. Data are shown as the mean ± SEM.
Figure 7
Figure 7. There were correlations between the level of LFP changes and fPSP amplitudes throughout the monitoring.
The four plots represent the highest concentration of significant correlations, specifically between the delta, theta, and beta bands recorded prior to HFS and the 120–150 min time point after HFS. The lower the delta in mPFC and MD, the higher the fPSP amplitudes (top). The higher the theta-beta in mPFC, the higher the fPSP amplitudes (bottom).

References

    1. Otani S (2003) Prefrontal cortex function, quasi-physiological stimuli, and synaptic plasticity. J Physiol Paris 97: 423–430. - PubMed
    1. Dalley JW, Cardinal RN, Robbins TW (2004) Prefrontal executive and cognitive functions in rodents: neural and neurochemical substrates. Neurosci Biobehav Rev 28: 771–784. - PubMed
    1. Goto Y, Yang CR, Otani S (2010) Functional and dysfunctional synaptic plasticity in prefrontal cortex: roles in psychiatric disorders. Biol Psychiatry 67: 199–207. - PubMed
    1. Vertes RP (2006) Interactions among the medial prefrontal cortex, hippocampus and midline thalamus in emotional and cognitive processing in the rat. Neuroscience 142: 1–20. - PubMed
    1. Pirot S, Jay TM, Glowinski J, Thierry AM (1994) Anatomical and electrophysiological evidence for an excitatory amino acid pathway from the thalamic mediodorsal nucleus to the prefrontal cortex in the rat. Eur J Neurosci 6: 1225–1234. - PubMed

Publication types

MeSH terms