

Explaining spatial heterogeneity in population dynamics and genetics from spatial variation in resources for a large herbivore
- PMID: 23118900
- PMCID: PMC3485331
- DOI: 10.1371/journal.pone.0047858
Explaining spatial heterogeneity in population dynamics and genetics from spatial variation in resources for a large herbivore
Abstract
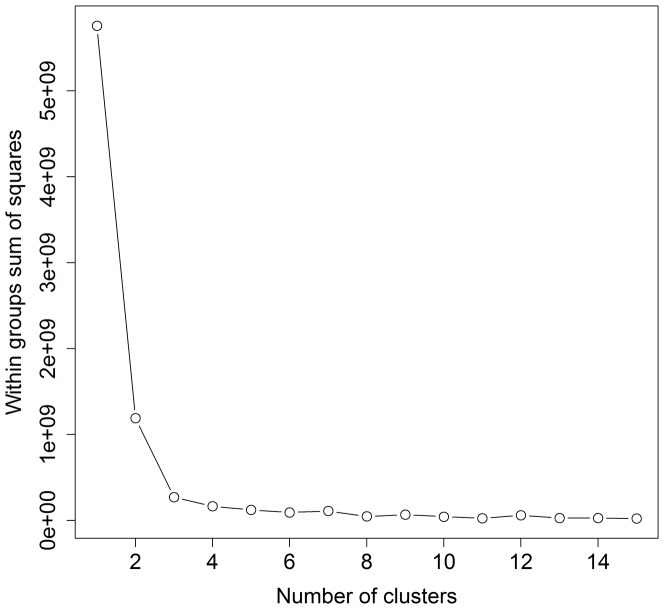
Fine-scale spatial variation in genetic relatedness and inbreeding occur across continuous distributions of several populations of vertebrates; however, the basis of observed variation is often left untested. Here we test the hypothesis that prior observations of spatial patterns in genetics for an island population of feral horses (Sable Island, Canada) were the result of spatial variation in population dynamics, itself based in spatial heterogeneity in underlying habitat quality. In order to assess how genetic and population structuring related to habitat, we used hierarchical cluster analysis of water sources and an indicator analysis of the availability of important forage species to identify a longitudinal gradient in habitat quality along the length of Sable Island. We quantify a west-east gradient in access to fresh water and availability of two important food species to horses: sandwort, Honckenya peploides, and beach pea, Lathyrus japonicas. Accordingly, the population clusters into three groups that occupy different island segments (west, central, and east) that vary markedly in their local dynamics. Density, body condition, and survival and reproduction of adult females were highest in the west, followed by central and east areas. These results mirror a previous analysis of genetics, which showed that inbreeding levels are highest in the west (with outbreeding in the east), and that there are significant differences in fixation indices among groups of horses along the length of Sable Island. Our results suggest that inbreeding depression is not an important limiting factor to the horse population. We conclude that where habitat gradients exist, we can anticipate fine-scale heterogeneity in population dynamics and hence genetics.
Conflict of interest statement
Figures


References
-
- Coulson T, Albon S, Guinness F, Pemberton J, Clutton-Brock T (1997) Population substructure, local density, and calf winter survival in red deer (Cervus elaphus). Ecology 78: 852–863.
-
- Coltman DW, Pilkington JG, Pemberton JM (2003) Fine-scale genetic structure in a free-living ungulate population. Mol Ecol 12: 733–742. - PubMed
-
- Nussey DH, Coltman DW, Coulson T, Kruuk LEB, Donald A, et al. (2005) Rapidly declining fine-scale spatial genetic structure in female red deer. Mol Ecol 14: 3395–3405. - PubMed
-
- Brazeau DA, Sammarco PW, Atchison AD (2011) Micro-scale genetic heterogeneity and structure in coral recruitment: fine-scale patchiness. Aquat Biol 12: 55–67.
Publication types
MeSH terms
Substances
LinkOut - more resources
Full Text Sources
