

Plasmodium falciparum field isolates from South America use an atypical red blood cell invasion pathway associated with invasion ligand polymorphisms
- PMID: 23118907
- PMCID: PMC3485327
- DOI: 10.1371/journal.pone.0047913
Plasmodium falciparum field isolates from South America use an atypical red blood cell invasion pathway associated with invasion ligand polymorphisms
Abstract
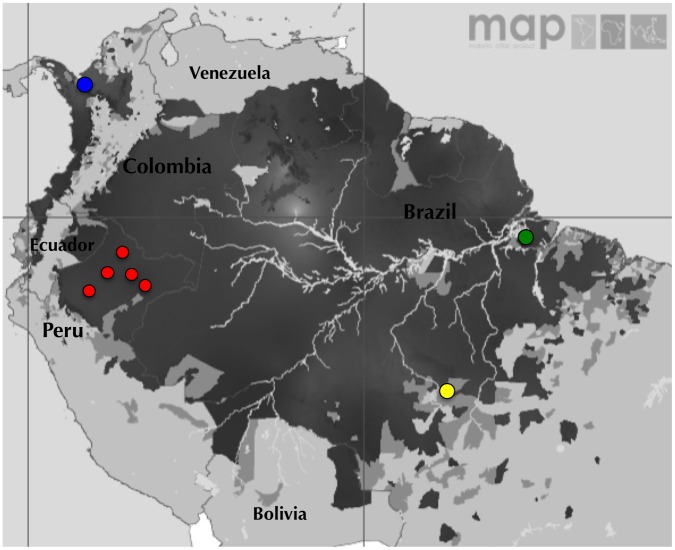
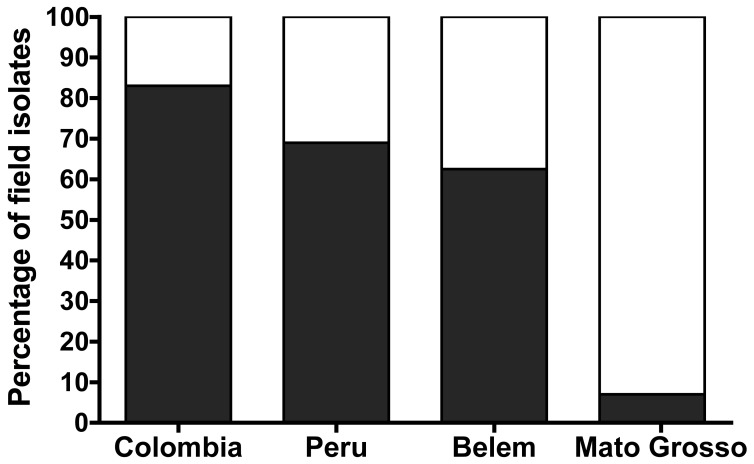
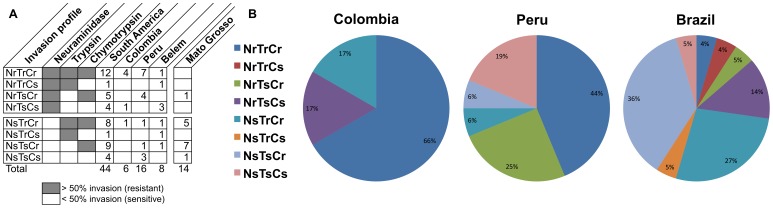
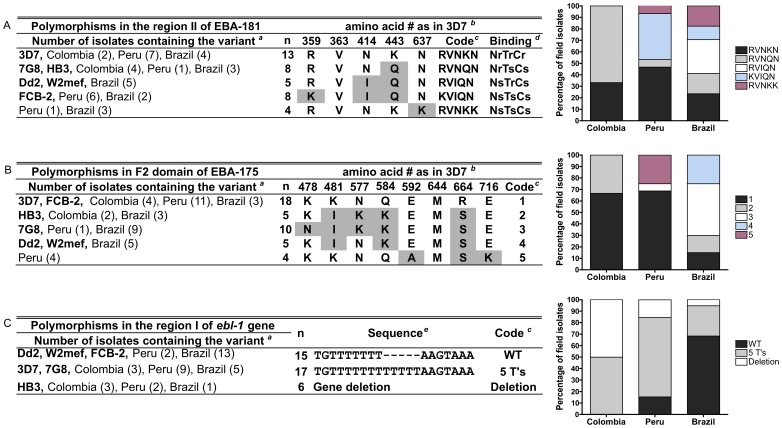
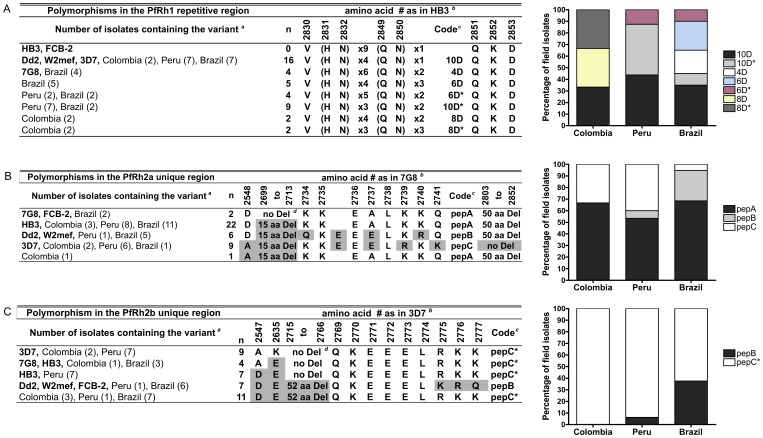
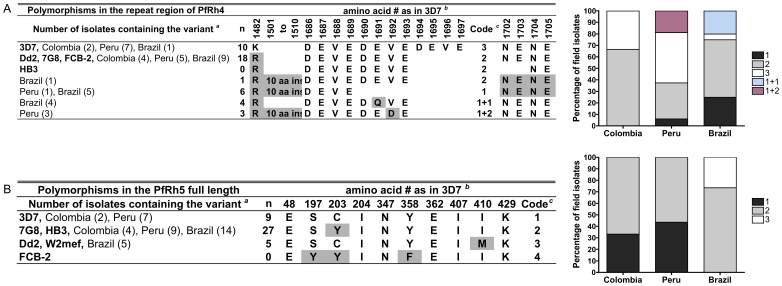
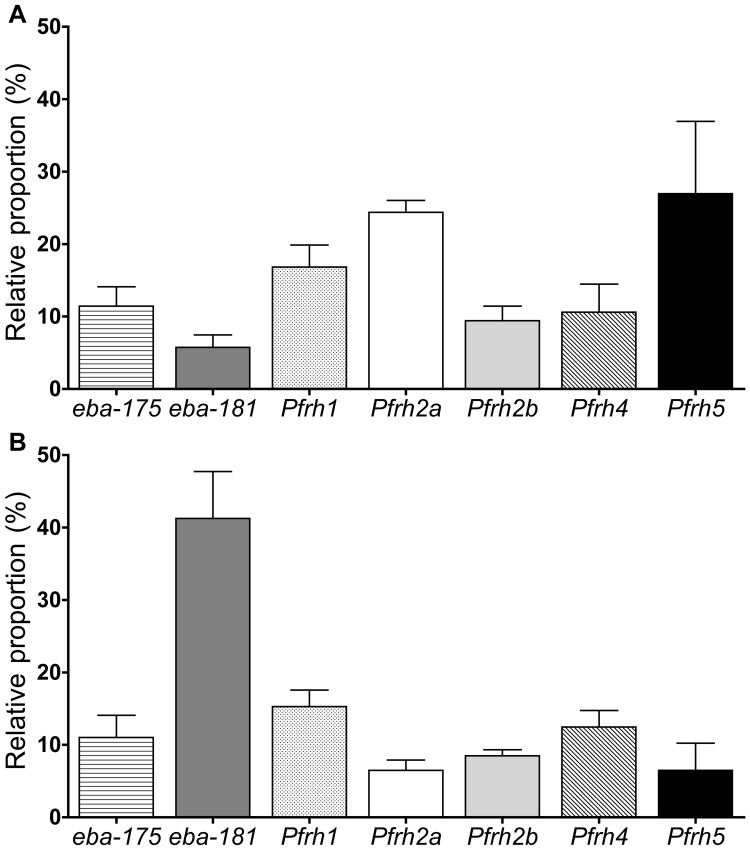
Studies of Plasmodium falciparum invasion pathways in field isolates have been limited. Red blood cell (RBC) invasion is a complex process involving two invasion protein families; Erythrocyte Binding-Like (EBL) and the Reticulocyte Binding-Like (PfRh) proteins, which are polymorphic and not fully characterized in field isolates. To determine the various P. falciparum invasion pathways used by parasite isolates from South America, we studied the invasion phenotypes in three regions: Colombia, Peru and Brazil. Additionally, polymorphisms in three members of the EBL (EBA-181, EBA-175 and EBL-1) and five members of the PfRh (PfRh1, PfRh2a, PfRh2b, PfRh4, PfRh5) families were determined. We found that most P. falciparum field isolates from Colombia and Peru invade RBCs through an atypical invasion pathway phenotypically characterized as resistant to all enzyme treatments (NrTrCr). Moreover, the invasion pathways and the ligand polymorphisms differed substantially among the Colombian and Brazilian isolates while the Peruvian isolates represent an amalgam of those present in the Colombian and Brazilian field isolates. The NrTrCr invasion profile was associated with the presence of the PfRh2a pepC variant, the PfRh5 variant 1 and EBA-181 RVNKN variant. The ebl and Pfrh expression levels in a field isolate displaying the NrTrCr profile also pointed to PfRh2a, PfRh5 and EBA-181 as being possibly the major players in this invasion pathway. Notably, our studies demonstrate the uniqueness of the Peruvian P. falciparum field isolates in terms of their invasion profiles and ligand polymorphisms, and present a unique opportunity for studying the ability of P. falciparum parasites to expand their invasion repertoire after being reintroduced to human populations. The present study is directly relevant to asexual blood stage vaccine design focused on invasion pathway proteins, suggesting that regional invasion variants and global geographical variation are likely to preclude a simple one size fits all type of vaccine.
Conflict of interest statement
Figures
Similar articles
-
Anti-Plasmodium falciparum invasion ligand antibodies in a low malaria transmission region, Loreto, Peru.Malar J. 2012 Oct 30;11:361. doi: 10.1186/1475-2875-11-361. Malar J. 2012. PMID: 23110555 Free PMC article.
-
Reticulocyte and erythrocyte binding-like proteins function cooperatively in invasion of human erythrocytes by malaria parasites.Infect Immun. 2011 Mar;79(3):1107-17. doi: 10.1128/IAI.01021-10. Epub 2010 Dec 13. Infect Immun. 2011. PMID: 21149582 Free PMC article.
-
Plasmodium falciparum reticulocyte-binding homologues are targets of human inhibitory antibodies and play a role in immune evasion.Front Immunol. 2025 Mar 25;16:1532451. doi: 10.3389/fimmu.2025.1532451. eCollection 2025. Front Immunol. 2025. PMID: 40201183 Free PMC article.
-
Erythrocyte and reticulocyte binding-like proteins of Plasmodium falciparum.Trends Parasitol. 2012 Jan;28(1):23-30. doi: 10.1016/j.pt.2011.10.002. Epub 2011 Dec 16. Trends Parasitol. 2012. PMID: 22178537 Review.
-
Erythrocyte glycophorins as receptors for Plasmodium merozoites.Parasit Vectors. 2019 Jun 24;12(1):317. doi: 10.1186/s13071-019-3575-8. Parasit Vectors. 2019. PMID: 31234897 Free PMC article. Review.
Cited by
-
Blood donor variability is a modulatory factor for P. falciparum invasion phenotyping assays.Sci Rep. 2021 Mar 29;11(1):7129. doi: 10.1038/s41598-021-86438-1. Sci Rep. 2021. PMID: 33782439 Free PMC article.
-
Quantitation of malaria parasite-erythrocyte cell-cell interactions using optical tweezers.Biophys J. 2014 Aug 19;107(4):846-53. doi: 10.1016/j.bpj.2014.07.010. Biophys J. 2014. PMID: 25140419 Free PMC article.
-
RBC barcoding allows for the study of erythrocyte population dynamics and P. falciparum merozoite invasion.PLoS One. 2014 Jul 1;9(7):e101041. doi: 10.1371/journal.pone.0101041. eCollection 2014. PLoS One. 2014. PMID: 24984000 Free PMC article.
-
Malian field isolates provide insight into Plasmodium malariae intra-erythrocytic development and invasion.PLoS Negl Trop Dis. 2025 Jan 6;19(1):e0012790. doi: 10.1371/journal.pntd.0012790. eCollection 2025 Jan. PLoS Negl Trop Dis. 2025. PMID: 39761327 Free PMC article.
-
Analysis of Plasmodium falciparum Rh2b deletion polymorphism across different transmission areas.Sci Rep. 2020 Jan 30;10(1):1498. doi: 10.1038/s41598-020-58300-3. Sci Rep. 2020. PMID: 32001728 Free PMC article.
References
-
- WHO (2011) World malaria report 2011. Geneva: WHO. 248 p.
Publication types
MeSH terms
Substances
Grants and funding
LinkOut - more resources
Full Text Sources
Molecular Biology Databases
