. 2012;7(10):e48198.
doi: 10.1371/journal.pone.0048198. Epub 2012 Oct 31.

Variation revealed by SNP genotyping and morphology provides insight into the origin of the tomato

Affiliations

Variation revealed by SNP genotyping and morphology provides insight into the origin of the tomato

Jose Blanca et al. PLoS One. 2012.

Abstract

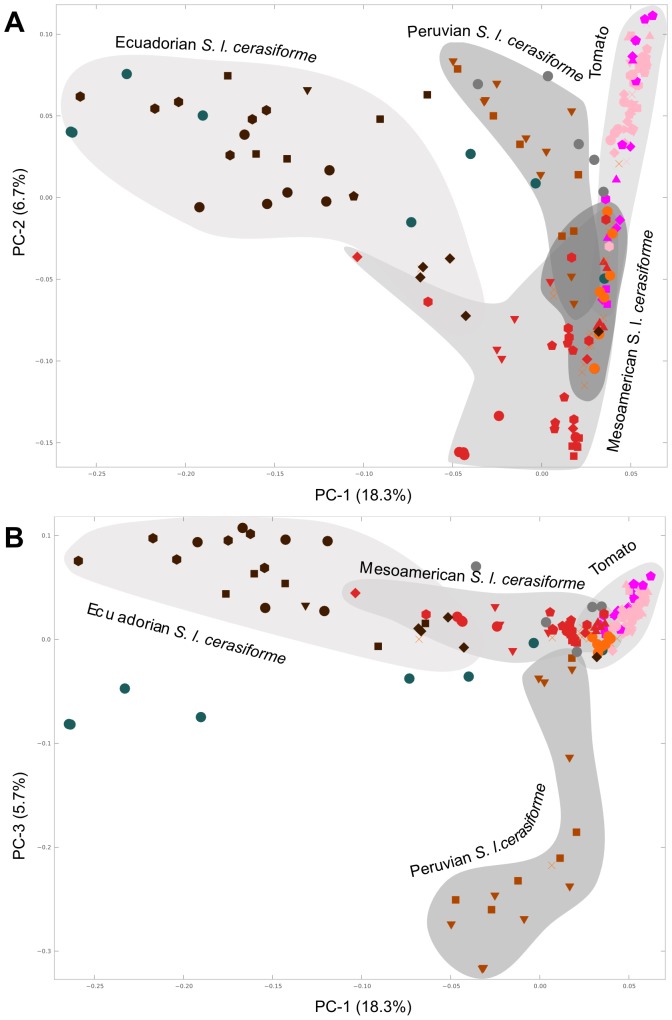
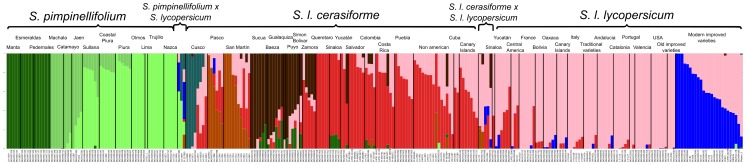
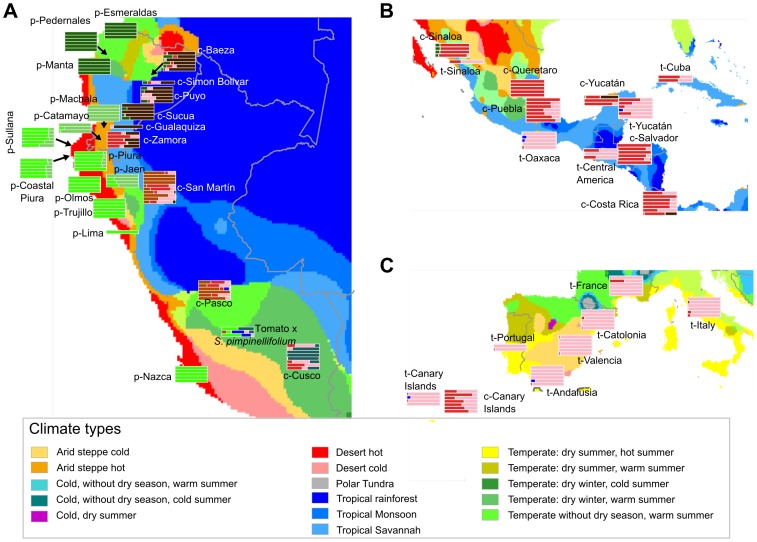
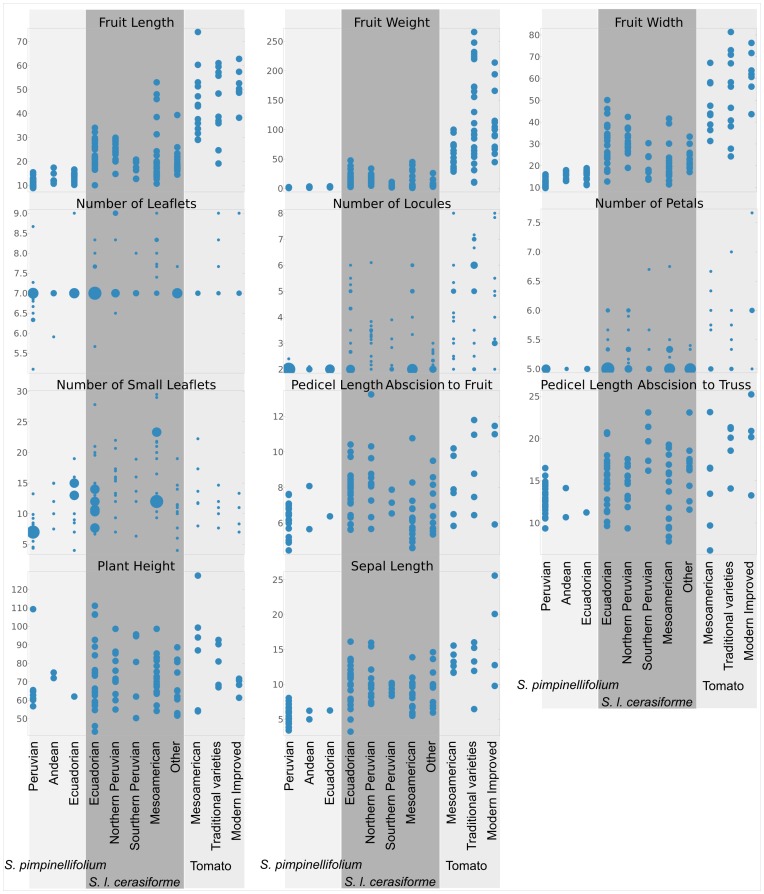
Tomato, Solanum lycopersicum, is divided into two widely distributed varieties: the cultivated S. lycopersicum var. lycopersicum, and the weedy S. lycopersicum var. cerasiforme. Solanum pimpinellifolium is the most closely related wild species of tomato.The roles of S. pimpinellifolium and S. l. cerasiforme during the domestication of tomato are still under debate. Some authors consider S. l. cerasiforme to be the ancestor, whereas others think that S. l. cerasiforme is an admixture of S. pimpinellifolium and the cultivated S. l. lycopersicum. It is also not clear whether the domestication occurred in the Andean region or in Mesoamerica. We characterized 272 accessions (63 S. pimpinellifolium, 106 S. l. cerasiforme, 95 S. l. lycopersicum and 8 derived from hybridization processes) were morphologically and genetically using the SolCap platform (7,414 SNPs). The two species were distinguished in a PCA analysis and displayed a rich geographic structure. Solanum lycopersicum var. cerasiforme and S. l. lycopersicum were also differentiated in the PCA and Structure analyses, which supports maintaining them as different varieties. Solanum pimpinellifolium and the Andean S. l. cerasiforme were more diverse than the non-Andean S. lycopersicum. Solanum lycopersicum var. cerasiforme was morphologically and molecularly intermediate between S. pimpinellifolium and tomato. Solanum lycopersicum var. cerasiforme, with the exception of several Ecuadorian and Mexican accessions, is composed of the products of admixture processes according to the Structure analysis. The non-admixtured S. l. cerasiforme might be similar to the ancestral cultivars from which the cultivated tomato originated, and presents remarkable morphological diversity, including fruits of up to 6 cm in diameter. The data obtained would fit a model in which a pre-domestication took place in the Andean region, with the domestication being completed in Mesoamerica. Subsequently, the Spaniards took plants from Mesoamerica to Spain and from there they were exported to the rest of the world.


Conflict of interest statement

Competing Interests: The authors have declared that no competing interests exist.

Figures

Figure 1
Figure 1. PCA analysis of all samples.
In panel A the projection along the first and second principal components of the PCA analysis carried out with the SNP genotypes is represented. Panel B corresponds to the same PCA analysis, but in this case the samples are projected along the first and third principal components. Every axis label includes the percentage of the eigenvalues corresponding to that principal component. The colors and marker shapes represent the different, mainly geographical, groups in which every species and variety has been divided, and which are detailed in the legend. This division matches the one stated in the column “Limited Group” of Supporting Table S1.
Figure 2
Figure 2. PCA analysis of S. lycopersicum.
PCA analysis of the S. lycopersicum samples. In this case, as in Figure 1, panels A and B represent projections along different principal components. The colors and marker shapes represent the different, mainly geographical, groups in which S. lycopersicum has been divided and which are specified in the legend of Figure 1.
Figure 3
Figure 3. Ancestries inferred by the Structure analysis.
Representation of the ancestries inferred for each sample by a Structure analysis carried out with 9 ancestral populations. Each bar corresponds to one accession and the color composition matches the ancestral population ancestry determined by Structure for that sample. The accessions belonging to each geographical group are separated by black bars and the captions specify the different geographical groups as they were assigned in the passport data included in Supporting Table S1.
Figure 4
Figure 4. Geographical distribution of the Structure ancestries.
The ancestries calculated by the Structure analysis are clustered by geographical group and represented at the corresponding geographical location. The ancestries' bar color matches those shown in Figure 3. The different colors of the geographical background correspond to the Köppen-Geiger climatic classification. The different climate types are detailed in the legend.
Figure 5
Figure 5. Qualitative morphological characters.
The distribution of the different qualitative morphological characters throughout the groups in which the different species and varieties have been divided is represented. Each chart corresponds to a different character and each bar to a different group. The percentages are calculated over the number of plants found to have every type of the character. The accession grouping is mainly geographical and is listed in the “Wide Group” column of Supporting Table S1.
Figure 6
Figure 6. Quantitative morphological characters.
The distribution of values for different quantitative morphological characters is represented for the groups in which the different species and varieties have been divided. Each chart corresponds to a different character and each column to a different group. In the continuous characters, each point in the scatter plots represents the mean value of the character for that accession, whereas in the discontinuous ones, the number of accessions that have the same value for the given character is represented by the diameter of the mark in the scatter plot. The accession grouping is the same as that used in Figure 5, is mainly geographical and is listed in the “Wide Group” column of Supporting Table S1.

References

    1. Peralta IE, Spooner DM, Knapp S (2008) Taxonomy of wild tomatoes and their relatives (Solanum sect. Lycopersicoides, sect. Juglandifolia, sect. Lycopersicon; Solanaceae). Ann Arbor, Mi.: American Society of Plant Taxonomists. 186 p., 181 lám. col. p.
    1. Warnock SJ (1991) Natural habitats of Lycopersicon species. HortScience 26: 466–471.
    1. Palmer JD, Zamir D (1982) Chloroplast DNA evolution and phylogenetic relationships in Lycopersicon . Proc Natl Acad Sci U S A 79: 5006–5010. - PMC - PubMed
    1. McClean PE, Hanson MR (1986) Mitochondrial DNA Sequence Divergence among Lycopersicon and Related Solanum Species. Genetics 112: 649–667. - PMC - PubMed
    1. Miller JC, Tanksley SD (1990) RFLP analysis of phylogenetic relationships and genetic variation in the genus Lycopersicon . Theoretical and applied genetics 80: 437–448. - PubMed